5 strategies to reduce false alerts in server monitoring
There are two types of alerts you don't want:
- Alerts that tell you something is wrong, but in reality, there isn't.
- Alerts you never receive when something is going wrong.
We call these false alerts. As a person with responsibility over your IT infrastructure, it is natural that you have configured your monitoring systems to alert you at every step. But when these false alerts take up too much of your time, one of these unfortunate scenarios may occur:
- You spend too much time validating false alerts, losing work-hours on an already low IT budget.
- Valid alerts get buried inside a mountain of false alerts, driving down mean time to repair.
- You treat every alert as a false alert. This leads to alert fatigue, a dangerous phenomenon and the reason behind many outages and security breaches.
Let's explore more about false alerts before we dive into five strategies to avoid them.
Why false positives happen
Put yourselves in the shoes of an IT director overseeing thousands of servers. Suddenly, you receive 11 alerts: 10 alerts for services going down and one alert stating there is a server down. Most of the enterprises today have configured alerts to create tickets in their ITSM tools, so this means 11 tickets assigned to multiple sysadmins. After hours of work, the reason for the 11 alerts is that one server went down—that server was just associated with 10 monitored services.
What should have been a single ticket, with just one person rectifying the problem, wasted hours of multiple sysadmins—hours that could have been put to use for other tickets.
Why alerts aren't triggered
Most monitoring platforms work on a threshold-based alerting strategy. In simple terms, a threshold breached equals an alert triggered. But there are two cases where you won't receive an alert even when a critical component of your IT infrastructure is down:
- The component is not monitored.
- The monitoring solution is not configured properly.
Let's say you have state of the art monitor for your IIS server but still your customers are getting too many time-out errors (HTTP 500s), request not found errors (404s and 414s), and request rejected errors (503s). Your customers are fuming, but you have no alerts in your mailbox and ticketing platforms. Why? You're monitoring only the performance and availability of your IIS servers but haven't configured alerts for when the total failed requests cross an acceptable threshold.
Five strategies to minimize false alerts
You can never eliminate false alerts, but you can minimize them. But tread with caution: efforts to reduce false alerts might backfire and make you miss valid alerts, which will be more expensive than an additional ticket.
What not to monitor
You can never be too careful when you are dealing with multiple servers, VMs, workstations, databases, network devices, clusters, and applications. But not everything needs the same level of stringent alerting. Industry best practice is to not set the same sensitive threshold-based alerting strategy for user acceptance testing (UAT) setups and less-critical systems. Therefore, you should define KPIs for each facet of your IT infrastructure and monitor only the KPIs that need it.
Always use tags and groups to segregate your resources being monitored. This helps in pushing different thresholds for different endpoints based on their functionality. Once you have tagged and grouped your hosts, it becomes easy to customize your thresholds, notification strategies, and automation actions with the help of configuration rules .
Differentiate spikes and outages
Your systems can handle a temporary and short-lived surge in resource utilization. If you require alerts from a VM when its load average goes above 0.9, what happens when a temporary spike pushes the load average to 0.91? You'll have two alerts:
- An alert stating the load average has breached the threshold and is now at 0.91.
- An alert telling you that everything is okay, and load average is now under 0.90.
Both of these alerts will be in your mailbox or ticketing platform in just under a minute. These alerts do not require any action from you. This may seem harmless for now, but it won't when you're working with hundreds or thousands of servers and endpoints.
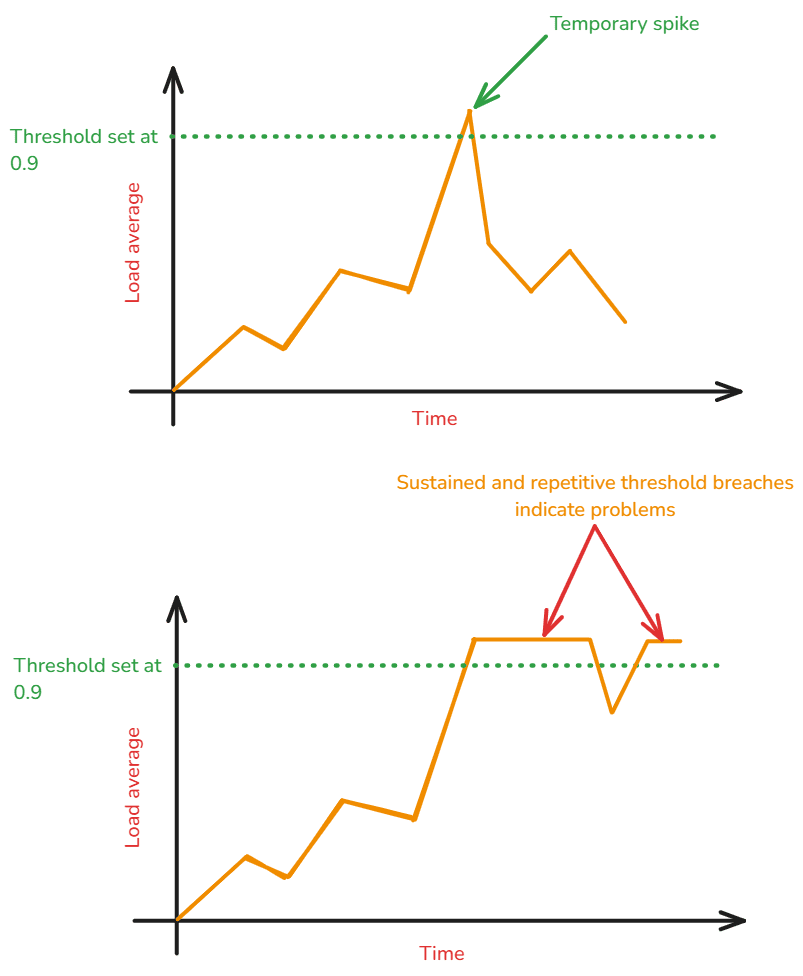
Use poll strategy (a.k.a., threshold-based alert strategy) to know when exactly the alert should be triggered. Based on the endpoint being monitored, you can choose whether the alert should be sent if a threshold is being breached for more than "n" data collection intervals, "x" minutes, and many more configurations.
Cascading alerts: Why get 100 alerts when you need 1?
IT infrastructure is inherently dependent. Your Kubernetes cluster can have 100 pods. When an OS patch renders the server down, it's preferable to get a single server down alert rather than one server down alert, one cluster down alert, and more irritatingly, 100 pod down alerts.
The solution? Mark dependent resources. When you assign a resource as dependent on another component in your IT infrastructure, you have instructed the monitoring platform not to trigger redundant alerts. This way, your team will be looking at the real problem instead of misleading alerts.
You can mark a monitor as dependent on another monitor any time from the edit monitor page in Site24x7. Utilize alert suppression techniques to weed out redundant alerts.
It's 2025, and auto-fix is standard
If your sysadmins are performing simple troubleshooting actions like restarting a service and running scripts after an alert, you need to squeeze more from your monitoring tool. When you are getting repetitive alerts from a partition containing log files every other day saying it is full, there should be an automation in place to zip the directories and move them to backups. These are the kind of basic tasks you should be offloading to your monitoring tool.
You can either have your own command line tools or specialized features integrated with monitoring platform, like IT Automation, to fix minor niggles, rather than burdening your team.
Expected alerts = bad alerts
If you know your scheduled restart is going to trigger a flurry of down alerts from all your affected servers, they are all unwanted, bad, and false alerts. Keep the number of expected alerts as close to zero as possible.
For example, if you know you'll get a VM down alert every Friday at 1900 hours, because that is exactly when you have set it to shut down, you need to configure your system to not alert you to this. These expected alerts take up too much of your time and mental bandwidth, leaving less time available for problems that require your attention.
Always let your monitoring tool know about planned maintenance windows so that all alerts are suppressed during that time frame. This helps you avoid alerts that are obvious and keeps your alert mailbox free of clutter.
Key takeaways
Here's the bottom line: Alerts are good, but false alerts are not. Luckily, there are simple strategies that keep your efforts focused on improving your IT infrastructure's reliability and functioning rather than chasing red herrings. Though these strategies can be easily applied with Site24x7, if you have your own setup in place, the strategies shared in this blog still hold. While configuring your monitors may be a daunting task, you'll be rewarded in the long run—though you'll have to do it only once with Site24x7.
Want to learn more about IT infrastructure? Check out these related articles:
- System availability and performance: Trends observed in 2024
- Server uptime: A metric you should not trust
- Server restarts: The silent threat to IT infrastructure
Topic Participants
Geoffrin Edwin