Transform your monitoring experience—Site24x7's Custom Dashboard
The dashboard in Site24x7 provides a solid foundation, but its true potential is unlocked through customization. Custom Dashboards enable you to personalize your monitoring experience, focusing on the metrics that matter most to you. By incorporating a variety of widgets, you can create a tailored and comprehensive view of your system's performance.
Site24x7’s Custom Dashboards come packed with features designed to elevate your monitoring capabilities:
Elevate your data insights with our customizable charts and widgets
To get the most out of your data insights, having customizable and versatile charts and widgets is essential. Site24x7’s Custom Dashboard delivers a range of tools to help you visualize and monitor your IT infrastructure effectively. Here’s how you can elevate your data analysis with our powerful features:
Wide range of widgets: Custom Dashboard provides a powerful suite of widgets categorized to enhance monitoring and data visualization across your IT infrastructure. Performance widgets keep a close eye on important metrics over time, making it easier to spot trends and patterns. To monitor how well your systems and applications are performing, deploy these widgets to track metrics like CPU usage, memory usage, and network traffic on your servers.
You can see how these metrics change over time, which helps you detect potential issues early and make informed decisions to improve performance. Tracking and gaining insights from these metrics is also super helpful for planning ahead so you have enough resources to handle future demands, and keep your IT infrastructure running smoothly. Minimizing downtime delivers a better experience for all users.
Enhanced visualization options: Visualize your data in a variety of formats like line, bar, pie, and area charts to find the best way to present your information. This flexibility helps you gain better insights and easily switch between different styles to fit your needs. To understand how performance changes over time, you might use line charts to track metrics like server response times. Bar charts are great for comparing performance across different teams or services, while pie charts show how resources are distributed. Area charts help you see how metrics build up over time. This way, you can choose the visualization that makes your data easiest to understand and able to adapt quickly as your analysis needs change.

Preview widgets: Enjoy real-time previews while creating your dashboard widgets. This feature enables you to configure settings and instantly visualize how the widget will look and function, streamlining your workflow customization efforts.
Simplify customization with templates and scheduling
With easy customization and scheduling tools, you can keep your dashboard up to date:
Dashboard templates: Use the power of templates to automatically customize widgets according to your monitoring requirements. This streamlined process eliminates manual adjustments, providing instant alignment with your monitoring objectives.
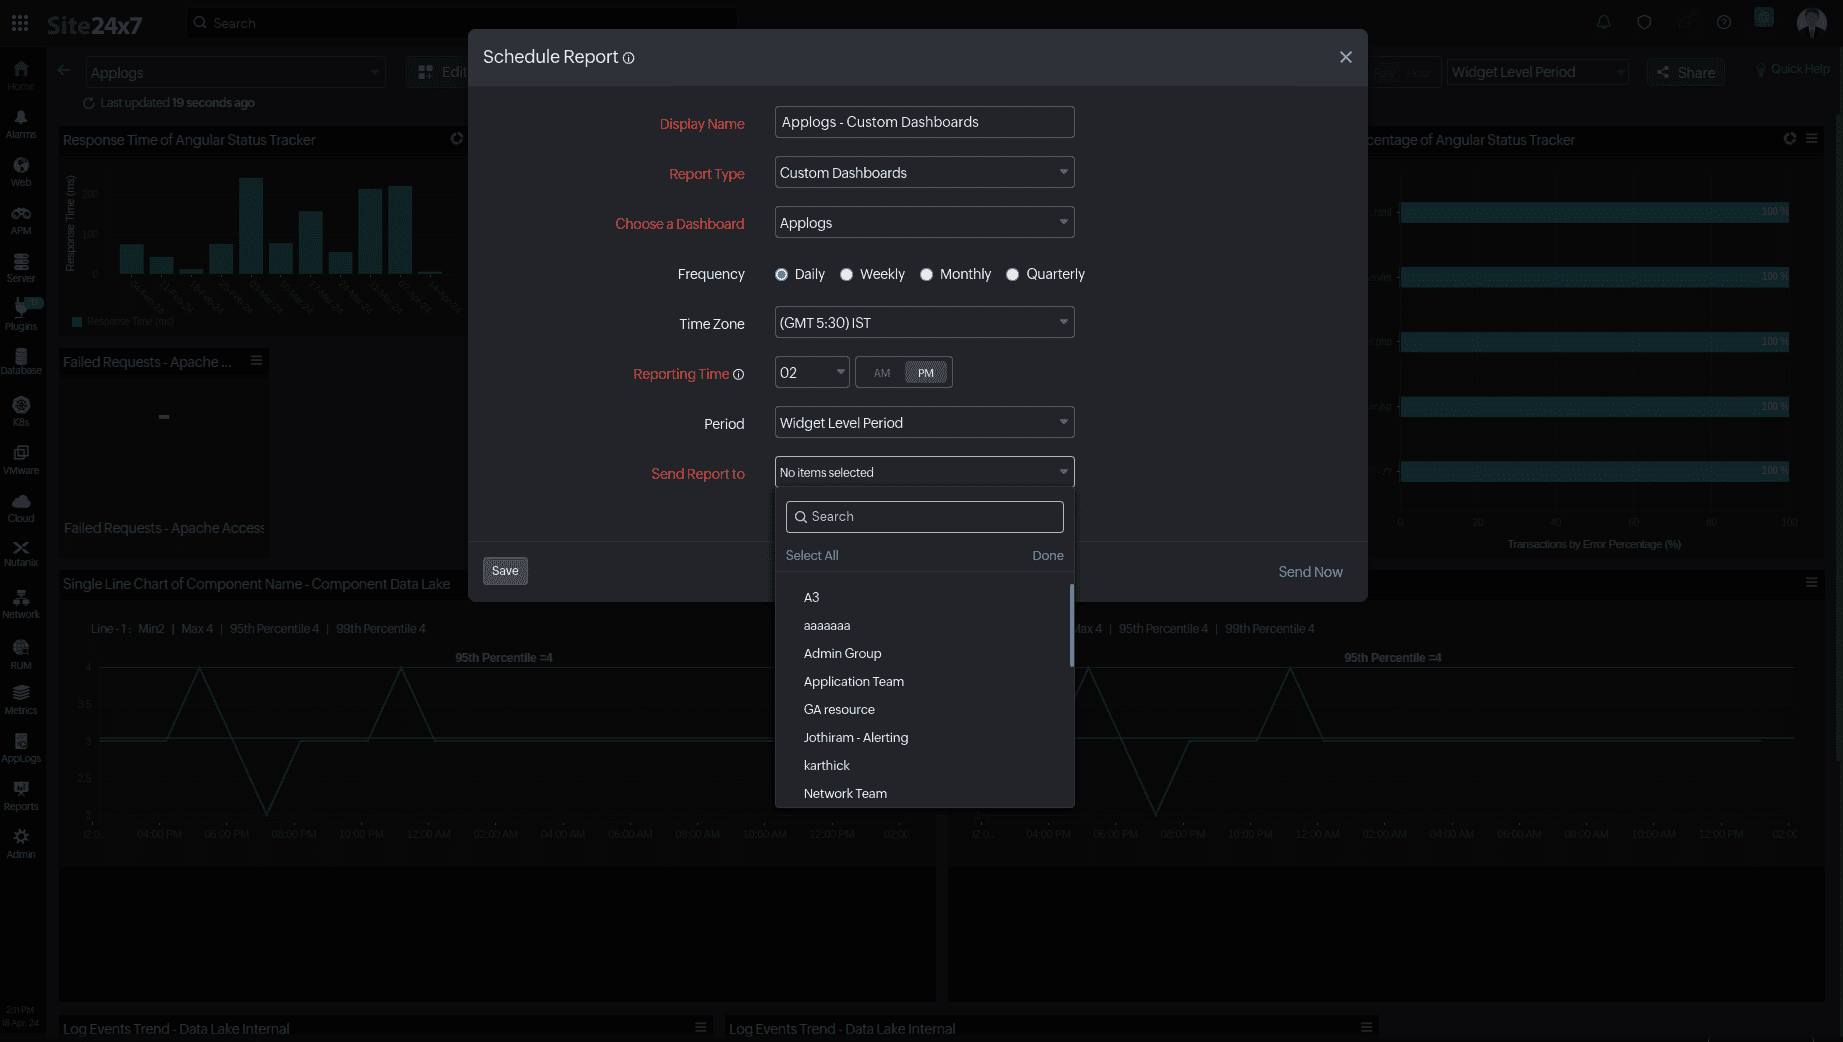
Schedule dashboard updates: Keep yourself in the loop with the latest monitoring insights delivered straight to your email inbox as a PDF. Set up these updates so you always receive the most current information available.
For example, if you want regular updates on how your resources are being used and the health of your network, you can schedule these reports to land in your inbox on a set schedule. This way, you're always up-to-date with the latest data and can easily stay on top of things.
Organize dashboards effortlessly with Site24x7's efficiency tools
To make the most out of your observability experience, having an organized and efficient dashboard is key. Site24x7 provides several powerful tools that help you streamline your dashboard setup, ensuring everything is in its right place and easy to manage. Let’s explore how these features can help you create an effective monitoring environment.
Widget grouping: Keep your dashboard organized by grouping related widgets together. This makes it easier to manage and ensures a clutter-free, visually appealing layout.
Auto-Arrange widgets: Let Site24x7 optimize your dashboard layout. The Auto-Arrange feature automatically positions your widgets for optimal visibility and usability, saving you time and ensuring a polished look.
Clone widgets: Quickly replicate widgets to create consistent monitoring layouts across your entire infrastructure. This feature saves time and ensures uniformity in your monitoring approach. For example, if you’ve set up a widget to monitor your AWS resources and now need the same setup for Azure and GCP, this feature lets you do that effortlessly. This way, you ensure that your monitoring dashboard layout is consistent across all of your cloud platforms, making it easier to keep everything on track.
Facilitate efficient collaboration with real-time insights
When everyone’s in sync, everything just works better. That’s the idea behind Site24x7’s NOC View and Custom Dashboards. By providing real-time data and collaboration tools, these features help your team catch issues early and stay on top of your IT environment. Let’s explore how they can help your team work more efficiently.
NOC view: The Network Operations Center (NOC) View delivers a real-time, comprehensive snapshot of your entire account's status on a single dashboard. Each monitor appears as a tile that shows its current status, enabling team members to quickly spot and address any issues. Clicking on a tile provides detailed information about the monitor, facilitating efficient collaboration.
For example, network administrators can use the NOC View to ensure everything is functioning smoothly in your IT environment. It enables them to oversee the entire infrastructure at a glance and promptly tackle any problems that arise.
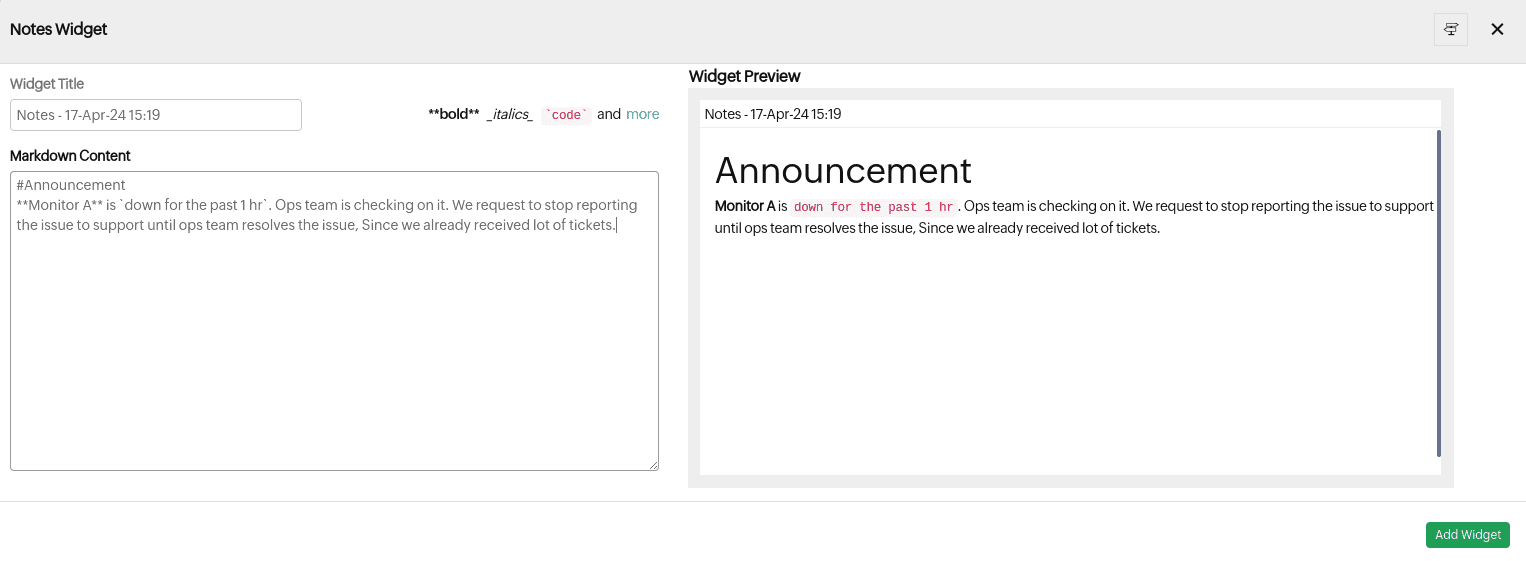
Share notes: Optimize collaboration within your team by adding important information to your dashboards using the Notes Widget. Share insights, updates, or instructions directly on your dashboard for better team communication.
Sharing options: Share your custom dashboards with colleagues and clients through exported PDFs. You can additionally embed iframe, and enable Dark Theme and IP address restrictions for controlled access, all managed conveniently via the custom dashboard sharing options. This makes it easy to distribute monitoring insights and performance data, ensuring that users have access to the information they need for informed decision-making and collaborative problem-solving.
IT managers that oversee complex network infrastructures can utilize Site24x7’s Custom Dashboard to highlight critical metrics such as server response times, network bandwidth usage, and application performance. Using the Widget Grouping and Auto-Arrange features, your dashboard is organized and easy to navigate. The Preview Widgets feature enables you to tweak your widgets for optimal display before finalizing your setup.
To keep your team informed, you schedule regular dashboard updates that are emailed as PDFs. This ensures everyone has access to the latest data. Additionally, you use the Notes Widget to share important insights and instructions, fostering better communication and collaboration among team members.
Site24x7’s Custom Dashboard provides a powerful, flexible, and user-friendly monitoring solution. Its advanced features enable you to optimize your monitoring strategy and improve efficiency within your team. Explore the possibilities and take your monitoring capabilities to the next level with Site24x7’s Custom Dashboard.
Topic Participants
Sri Varalakshmi