[New Feature] StatsD Metrics Monitoring
We are happy to introduce the metrics aggregation service from Site24x7!
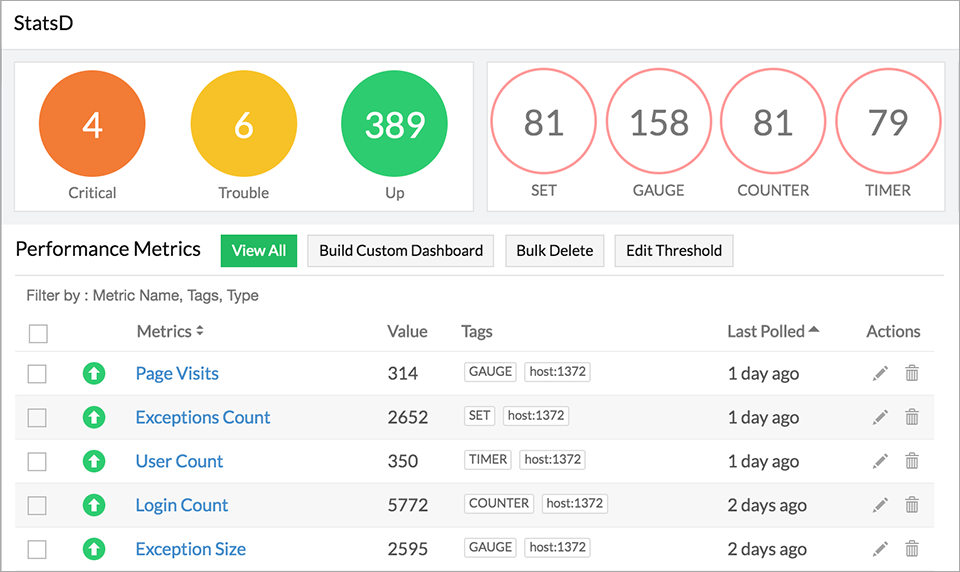
The Site24x7-StatsD integration will collect metrics from your custom applications through the StatsD protocol. You can monitor, compare, and visualize metrics across different dimensions and applications, from a single console.
Highlights:
- The Site24x7 Linux Monitoring agent will monitor the metrics pushed through the StatsD protocol.
- Supported performance metric types: Timer, counter, gauge, and set.
- Tag metrics and filter them by name, tags, and type.
- Set thresholds for every metric pushed to Site24x7 and receive timely alerts when they breach the configured value.
- Automate incident remediation with Site24x7 IT Automation.
How it Works:
A lightweight StatsD listener in the Linux server monitoring agent will collect and aggregate metrics. This allows easy collection of custom application metrics in Site24x7.
Get Started:
Ensure to have Linux agent version 17.7.0 and above to use this feature. Refer our help documentation for step-by-step instructions.
For any questions, comment in the below thread or get in touch with us at support@site24x7.com
Happy Monitoring!
Topic Participants
georgy.bychkovsky