Resolving Heroku deployment issues using comprehensive log data
Deploying applications on Heroku offers a streamlined process for developers, but even the most well-optimized setups can encounter deployment issues. To effectively resolve these issues, it's crucial to gain real-time insights into your app’s behavior, traffic, and performance metrics. The solution to resolving Heroku deployment challenges lies in leveraging the power of log management.
In this blog, we’ll explore how comprehensive log data can help troubleshoot and resolve Heroku deployment issues, ensuring smooth application performance and minimizing downtime.
Understanding the role of logs in Heroku deployments
Heroku is a robust Platform as a Service solution that simplifies the deployment, management, and scaling of applications. However, despite its many advantages, deploying applications on Heroku may sometimes lead to challenges, such as performance bottlenecks, unresponsive apps, or slow response times. In these scenarios, Heroku logs are indispensable tools for troubleshooting and swiftly resolving deployment issues.
Heroku’s Logplex router is responsible for collecting logs from various sources within the Heroku ecosystem, including dynos, routers, and runtimes. These logs are then sent to designated log drains, which aggregate log data and provide a comprehensive view of the application’s performance and behavior. This aggregation is critical for quickly identifying and addressing issues.
Heroku log drains support messaging via HTTPS, enabling the transmission of log data in batches to a designated HTTPS endpoint via POST requests. To enhance your log monitoring capabilities, Site24x7’s log management solution integrates seamlessly with Heroku log drains, offering real-time log analysis to resolve deployment issues efficiently. A standout feature of this integration is derived field support, which leverages regex rules to parse Heroku router log messages, enabling the extraction of meaningful data fields from raw log data.
Key metrics for monitoring your Heroku app
Once Site24x7 is integrated with your Heroku app, you can monitor real-time data through the Heroku dashboard. The following widgets are available by default and provide key metrics that help you track your app’s performance:
- Total Requests: The total number of requests processed by your app.
- Average Connection Time: The average time taken to establish connections.
- Average Service Time: The average time your app takes to process requests.
- Average Response Size: The size of the responses sent from your app.
- Failed Requests: The number of failed requests, helping identify potential issues.
- Top 20 Failed Requests: Detailed information on the top 20 failed requests and their causes.
- Request Trend: Insights into the request volume and how it fluctuates over time.
- Logging Levels: Provides visibility into the logging levels of various events.
- Status Code Stats: The distribution of HTTP status codes for monitoring app health.
- Service Time Stats: An overview of your app's service time, allowing for performance assessments.
- Top 50 Successful Requests: Identifies the most successful requests and the app's optimal performance.
- Top 10 Slowest Requests: Highlights the slowest requests to optimize app performance.
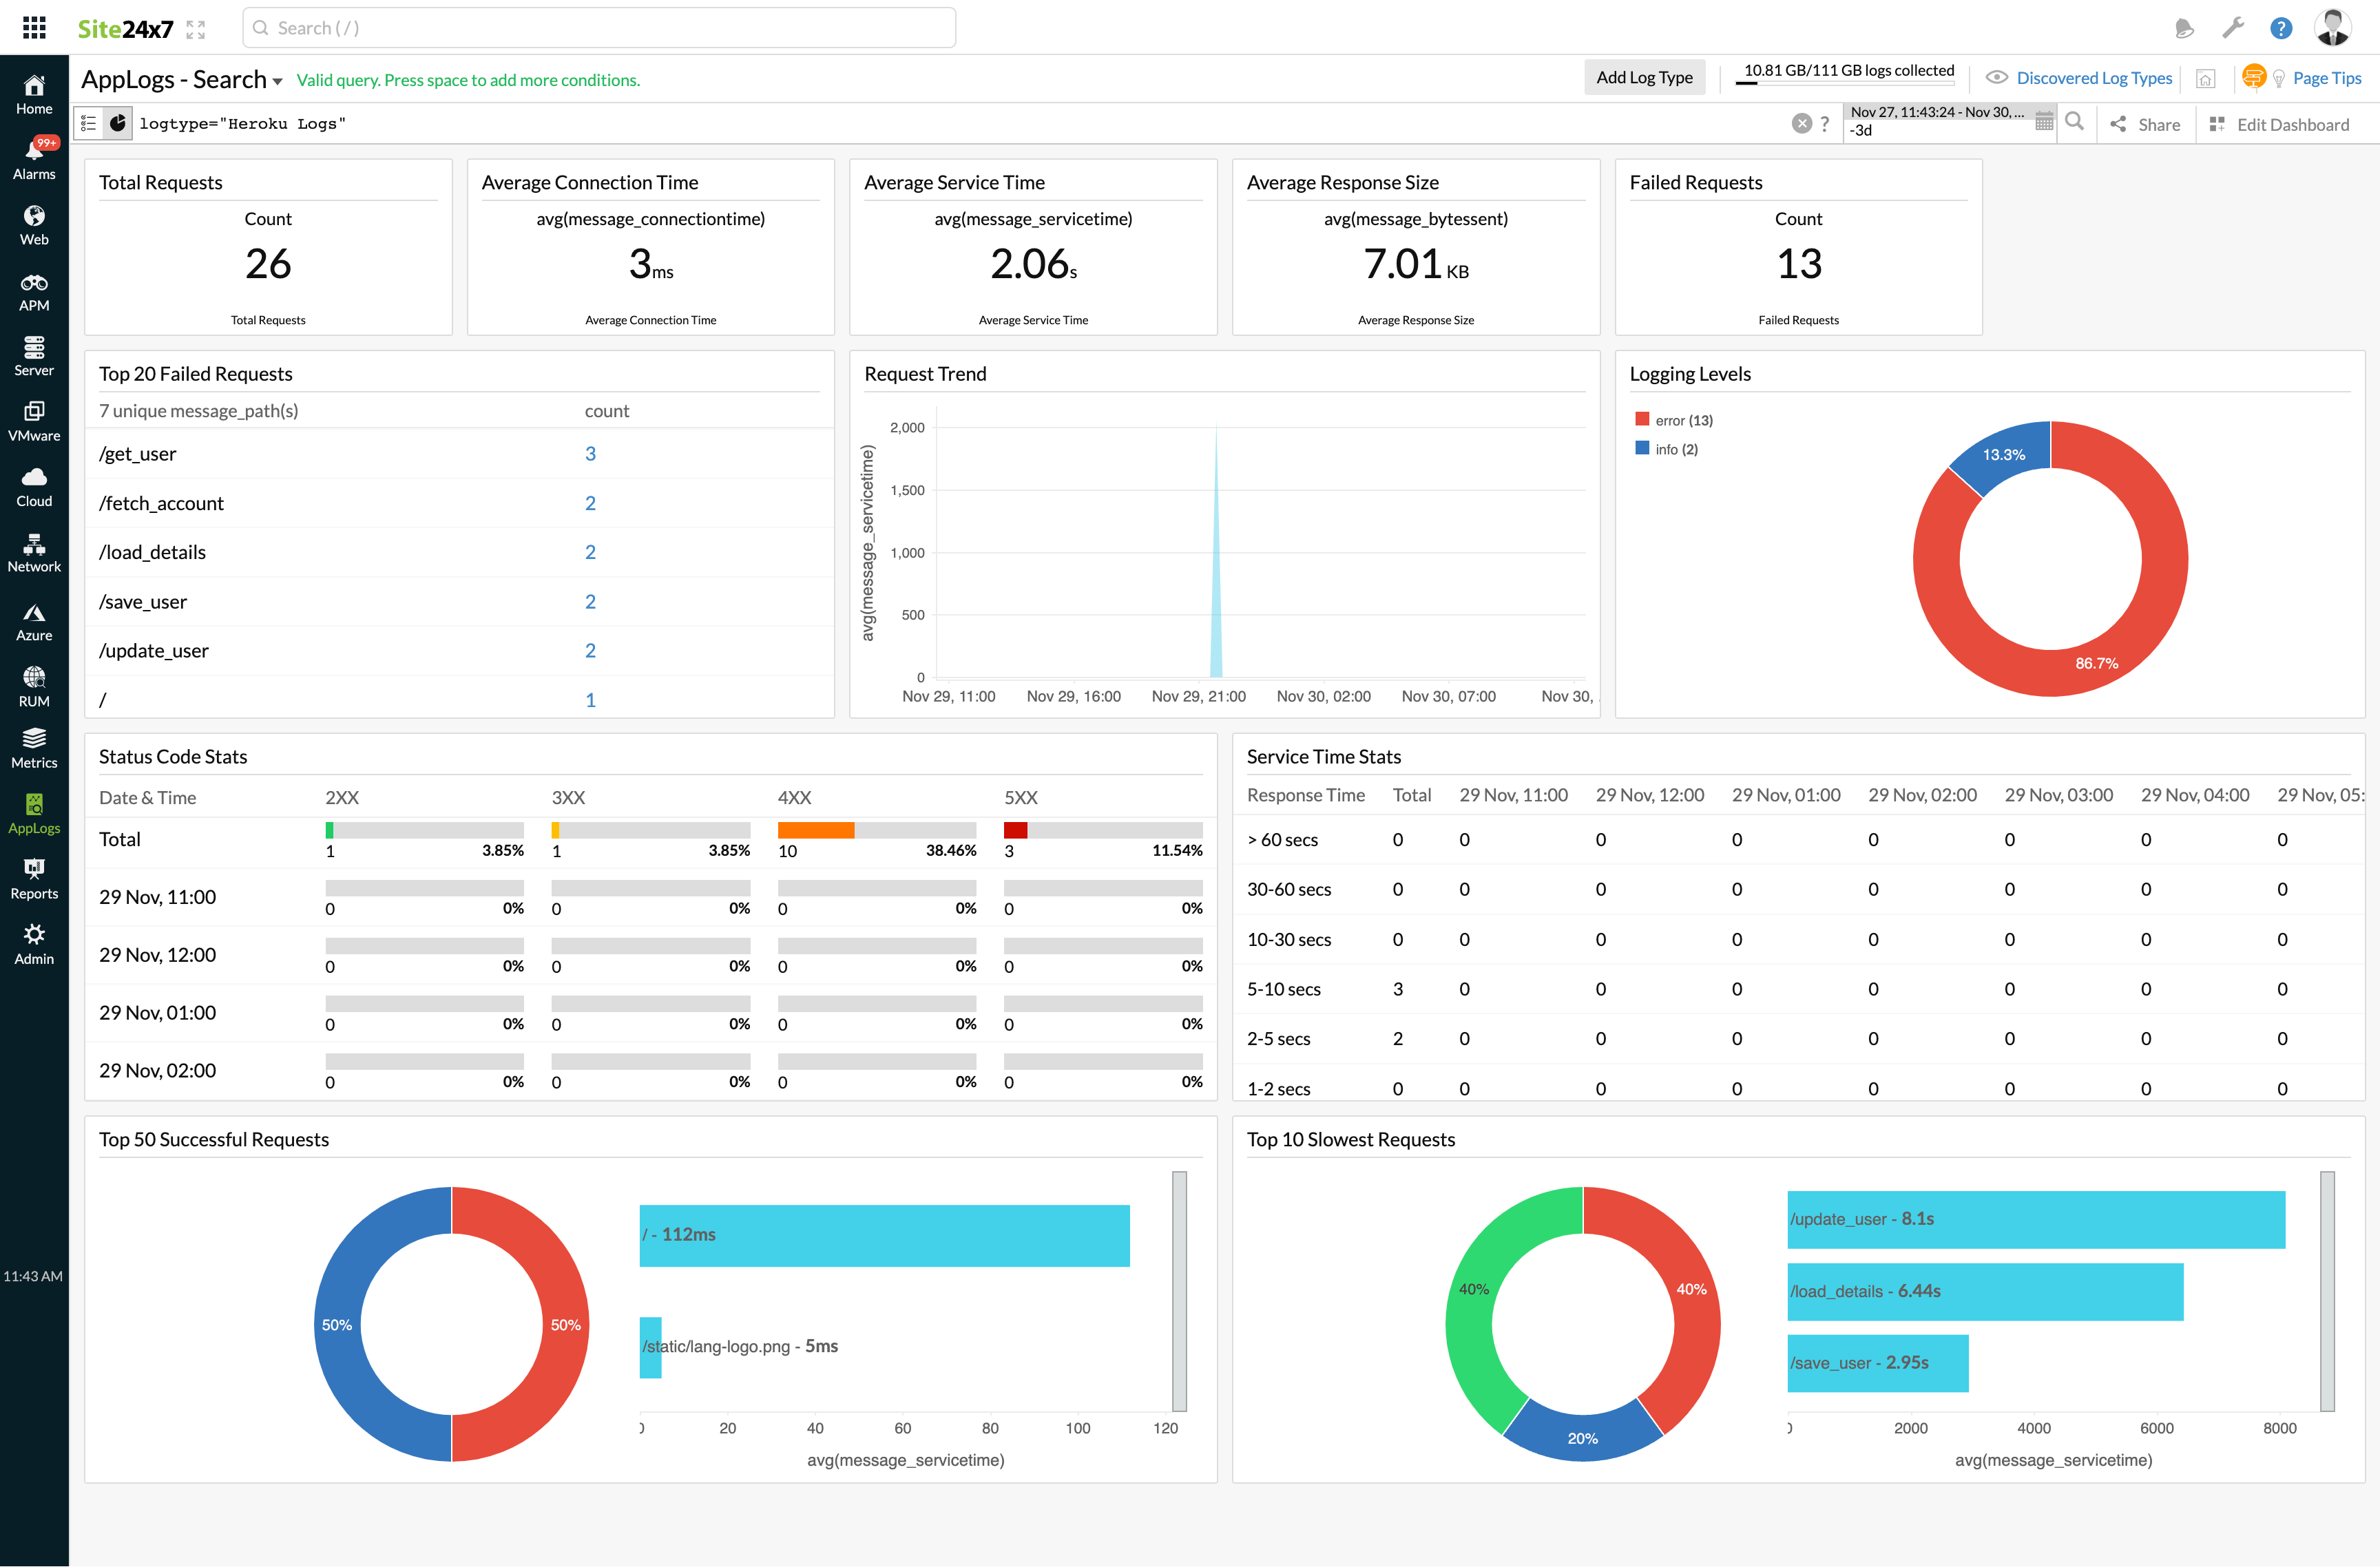
These metrics are invaluable for identifying availability and performance-related issues, such as high connection times, slow response sizes, or a surge in failed requests. By keeping a close watch on these data points, you can proactively troubleshoot and ensure smooth app performance.
Real-time use case for troubleshooting Heroku deployment issues
Scenario: You’ve deployed a new feature to your Heroku app, but users are reporting slow loading times and timeouts. You’ve noticed a degradation in the app’s performance following the deployment.
How Site24x7 helps:
- Identify failed requests: Review the Failed Requests and Top 20 Failed Requests metrics on the Heroku dashboard. These insights help determine if there are any failed attempts to load the new feature.
- Analyze response time: Use the Average Service Time and Top 10 Slowest Requests metrics to identify if the new feature is causing delays or performance slowdowns within the app.
- Investigate status codes: Examine the Status Code Stats to check for server-side errors (500-series) or client-side issues (4xx errors), which could signal deployment issues or misconfigurations.
Resolution: By analyzing these logs and metrics in real time, you can pinpoint whether the issue is in the application code, server load, or deployment process. Site24x7’s powerful log management capabilities make it easy to track down the root cause, whether it’s a misconfigured dyno, an error in the application code, or issues with resource allocation.
Conclusion
Start resolving Heroku deployment issues today with Site24x7—your ultimate solution for proactive log monitoring and management. With comprehensive log data and real-time insights, you can ensure optimal performance and seamless deployments for your Heroku applications.
Topic Participants
Subashree K