Analyze user behavior with RUM: Filterable performance insights to transform your business

Understanding how real users engage with a web application or website is crucial for the success of any business. Analyzing this data reveals vital insights into user behavior, performance metrics, and the overall experience. However, this vast amount of information can be both a blessing and a curse. While it holds the potential for invaluable insights, it often becomes overwhelming, making it difficult for teams to pinpoint specific performance issues affecting user experiences.
The challenge lies in sifting through this data to derive actionable insights. Site24x7's real user monitoring (RUM) provides filterable performance analysis that empowers teams to drill down into specific aspects of application performance. By clarifying complex datasets, Real user monitoring tools help teams enhance overall application performance and user satisfaction.
The importance of filterable performance analysis
Filterable performance analysis allows you to drill down into specific aspects of your application's performance. By applying filters, you can:
- Segment user data: Analyze performance based on different user segments, such as geographic locations, device types, or browsers.
- Identify performance issues: Pinpoint specific pages, asynchronous JavaScript and XML (AJAX) calls, or user actions that are causing performance problems.
- Correlate performance with user behavior: Understand how user behavior affects performance and identify patterns that may be contributing to issues.
- Track performance trends: Monitor changes in performance over time and identify emerging trends.
- Prioritize optimization efforts: Focus on areas that have the greatest impact on user experiences and business outcomes.
Key filtering capabilities for effective performance analysis
Navigating the vast amount of RUM data that is captured can be overwhelming, often hindering effective user behavior analysis. A robust monitoring solution is essential to addressing this challenge. Site24x7's advanced filtering capabilities enable hierarchical analysis, allowing users to apply filters at various levels. This drill-down approach empowers teams to narrow data down to specific subsets, providing the flexibility and control needed to uncover deeper insights and hidden patterns within the data.
Implementing filterable performance analysis with Site24x7's RUM tool
Integrate RUM into your web application by adding a script to your site and start collecting data as users interact with the site. Site24x7 offers auto RUM injection via APM agents, which enable easy RUM integration.
1. Define KPIs
Identify the KPIs that are the most relevant to your business goals. These might include load times, error rates, and user interaction metrics. Defining KPIs up front will help you focus your analysis and reporting efforts.
2. Segment your data
Once RUM is set up and data is being collected, the next step is to segment that data. Site24x7's RUM tool provides filtering options that allow you to slice the data based on different criteria. Here are some examples of how you can use filterable performance analysis to gain valuable insights into your application's performance:
- Analyze performance trends over time: Analyze performance over time to highlight peak usage hours and slowdowns. Filter data by time periods to track performance changes and identify trends.
- Correlate performance with user behavior: Analyze the user behavior on a website to track how visitors navigate through the pages, including the time spent on each webpage and on their overall sessions. This understanding is essential for enhancing user experiences and optimizing site performance.
- Identify regional performance differences: Filter data by geographic locations to identify regions where users are experiencing slower load times or higher error rates.
- Analyze performance by device types: Compare performance across different device types to identify device-specific issues.
- Investigate performance issues on specific pages: Filter data by page URLs to pinpoint pages that are causing performance problems.
3. Analyze the results
With your data segmented, you can begin to analyze the results. Look for patterns and anomalies that may indicate performance issues. For example, if users from a specific geographic region consistently experience slower load times, this could point to server or content delivery network (CDN) issues in that area.
4. Take action
Segmentation and analysis
4. Take action
The goal of performance analysis is to gain actionable insights into how to improve user experiences. This might involve optimizing images, reducing server response times, or making code adjustments. Continuous monitoring and analysis should become part of your regular workflows to ensure ongoing performance optimization.A case study: Filterable performance analysis in action
Initial findings
A case study: Filterable performance analysis in action
To illustrate the power of filterable performance analysis, let’s consider an e-commerce website, Zylker. After implementing RUM, the Zylker team began to notice performance discrepancies across various user segments.
Initial findings
Using RUM data, the team discovered that:
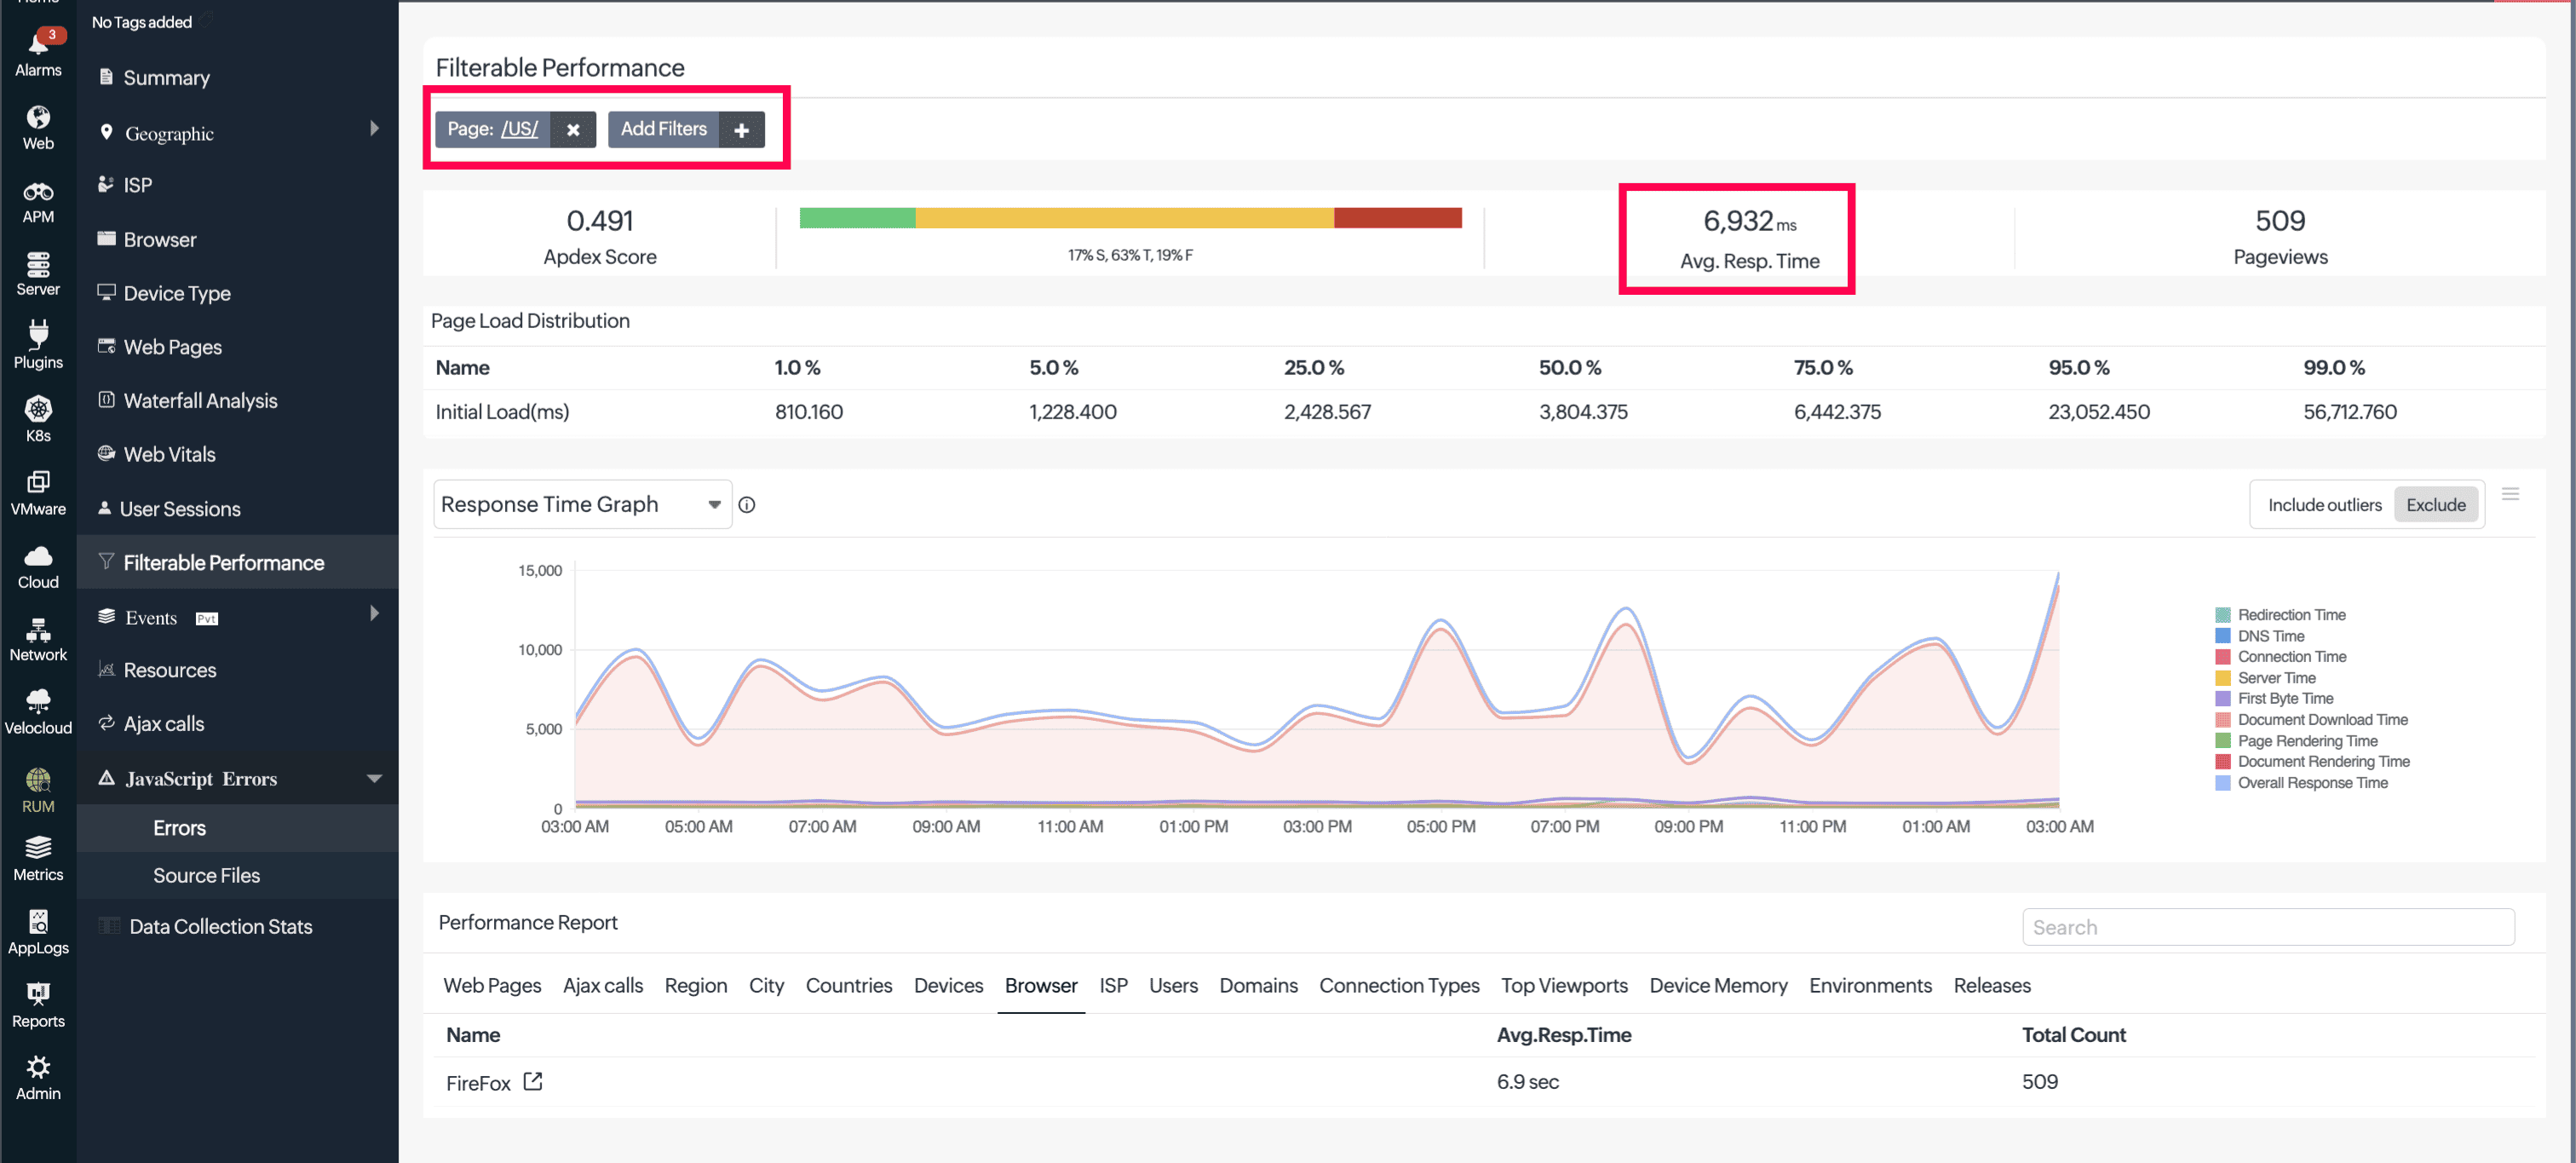
- Users in the United States experienced an average response time of seven seconds, compared to just two seconds for users in India.

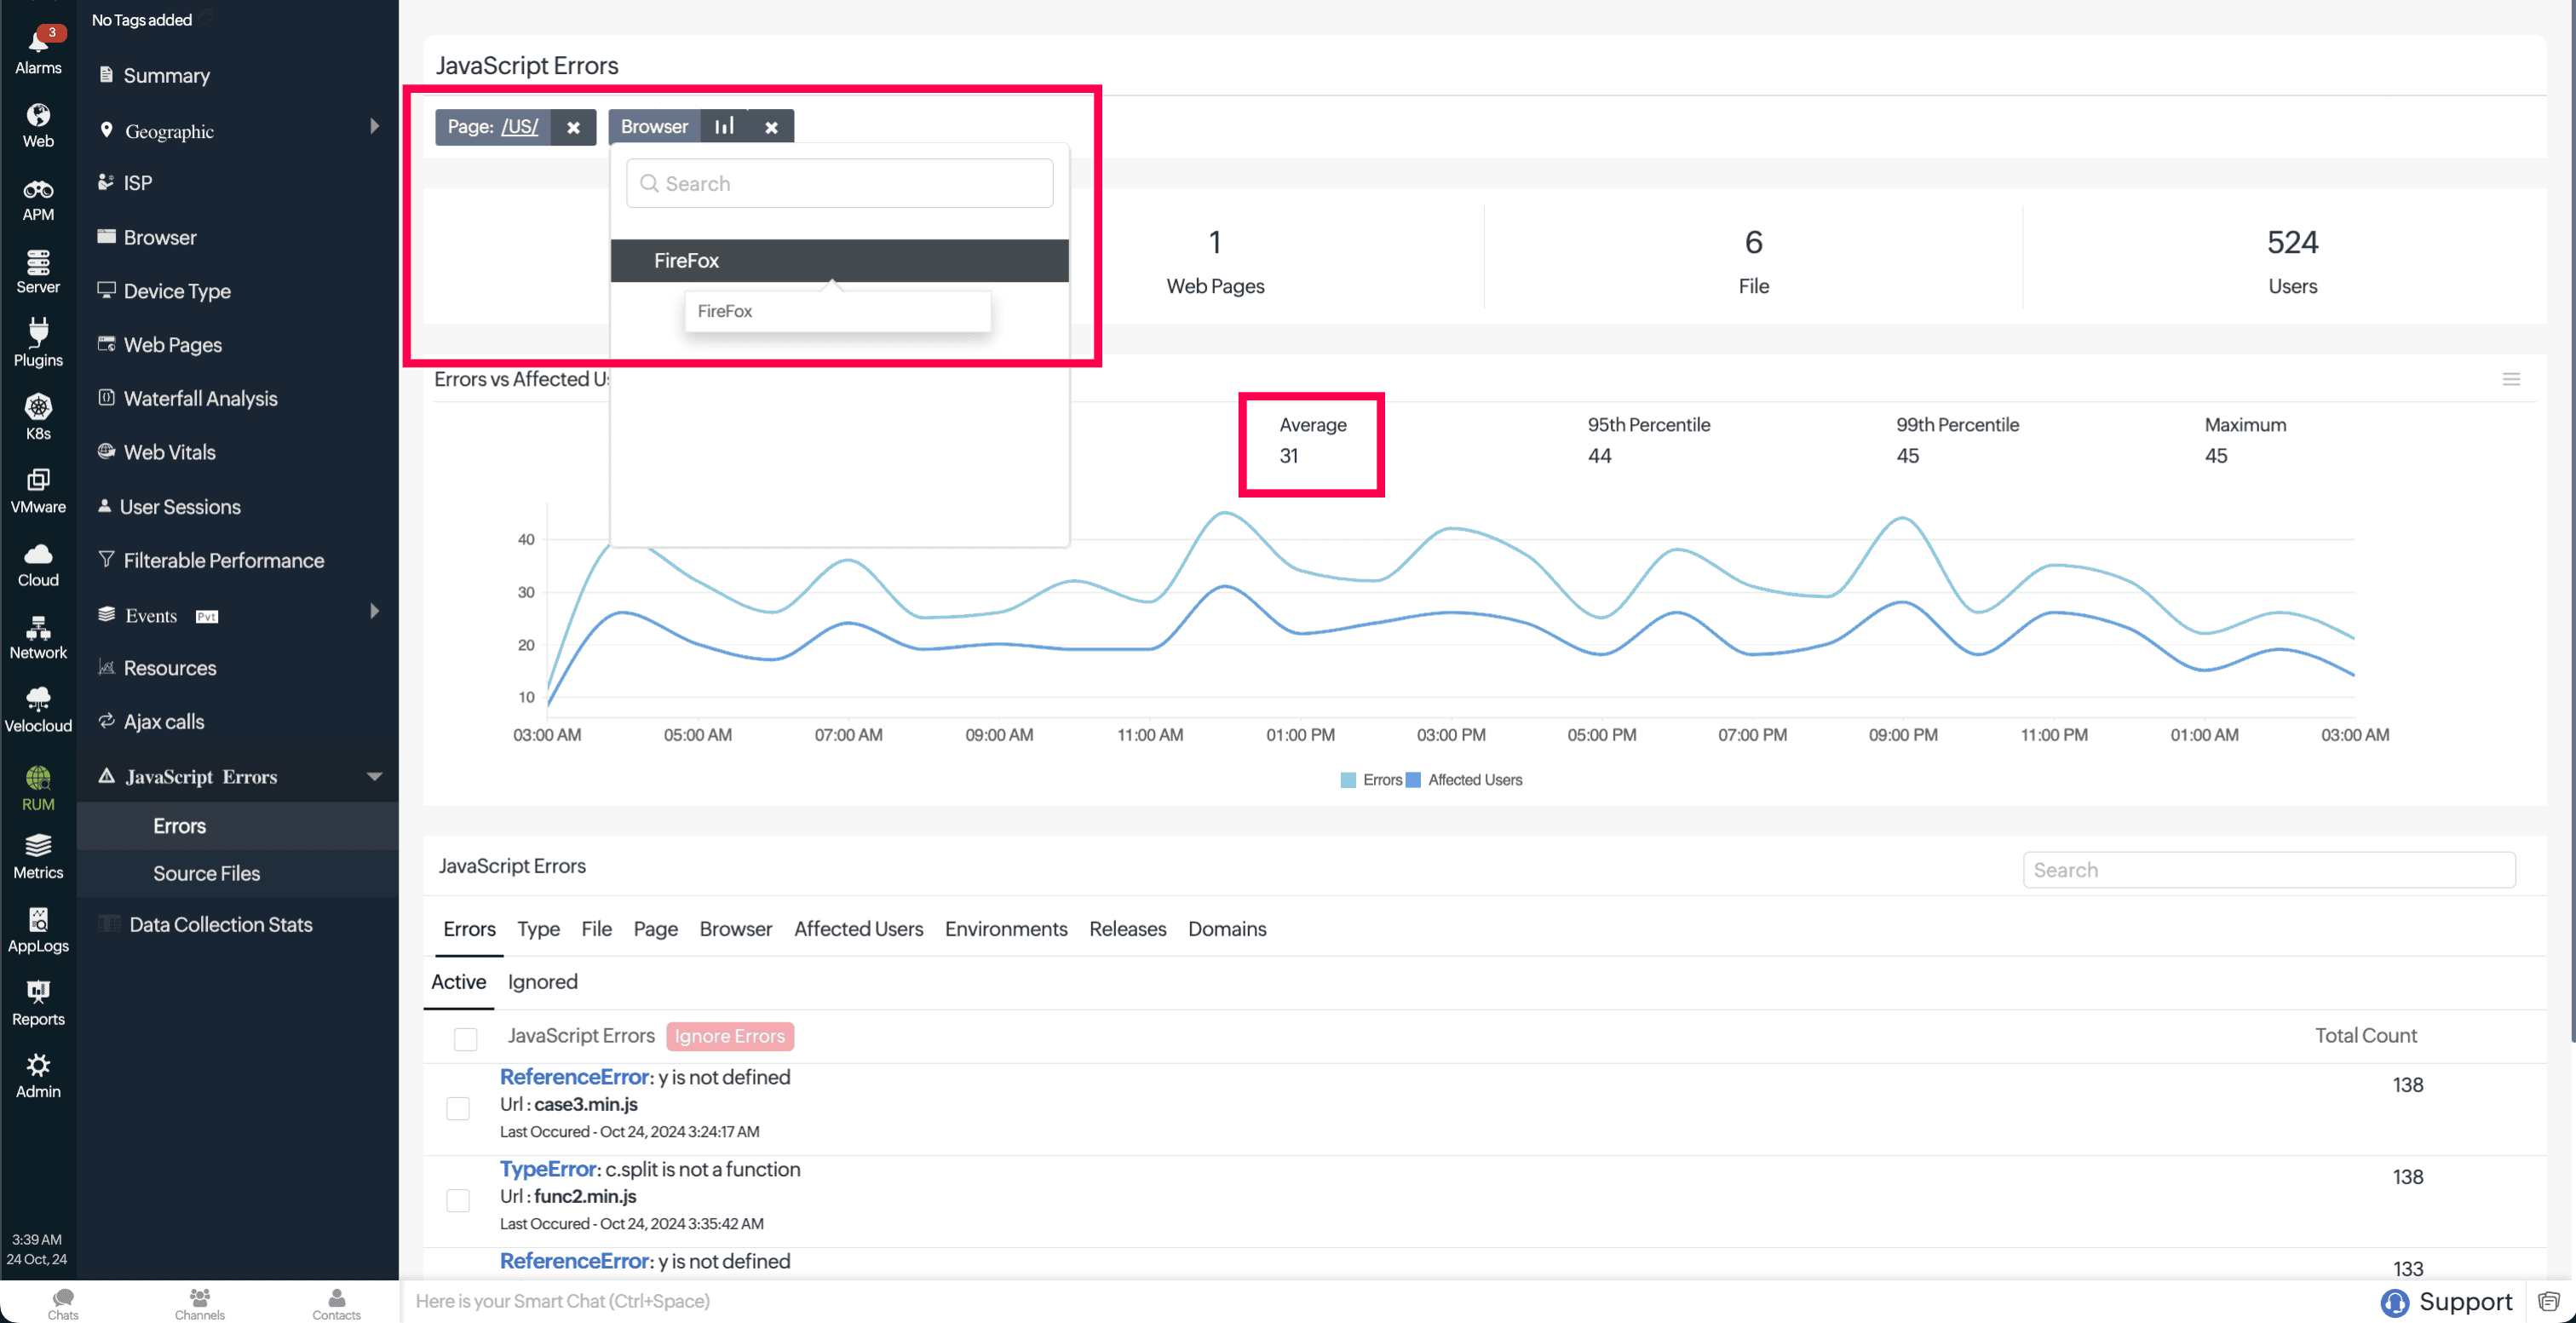
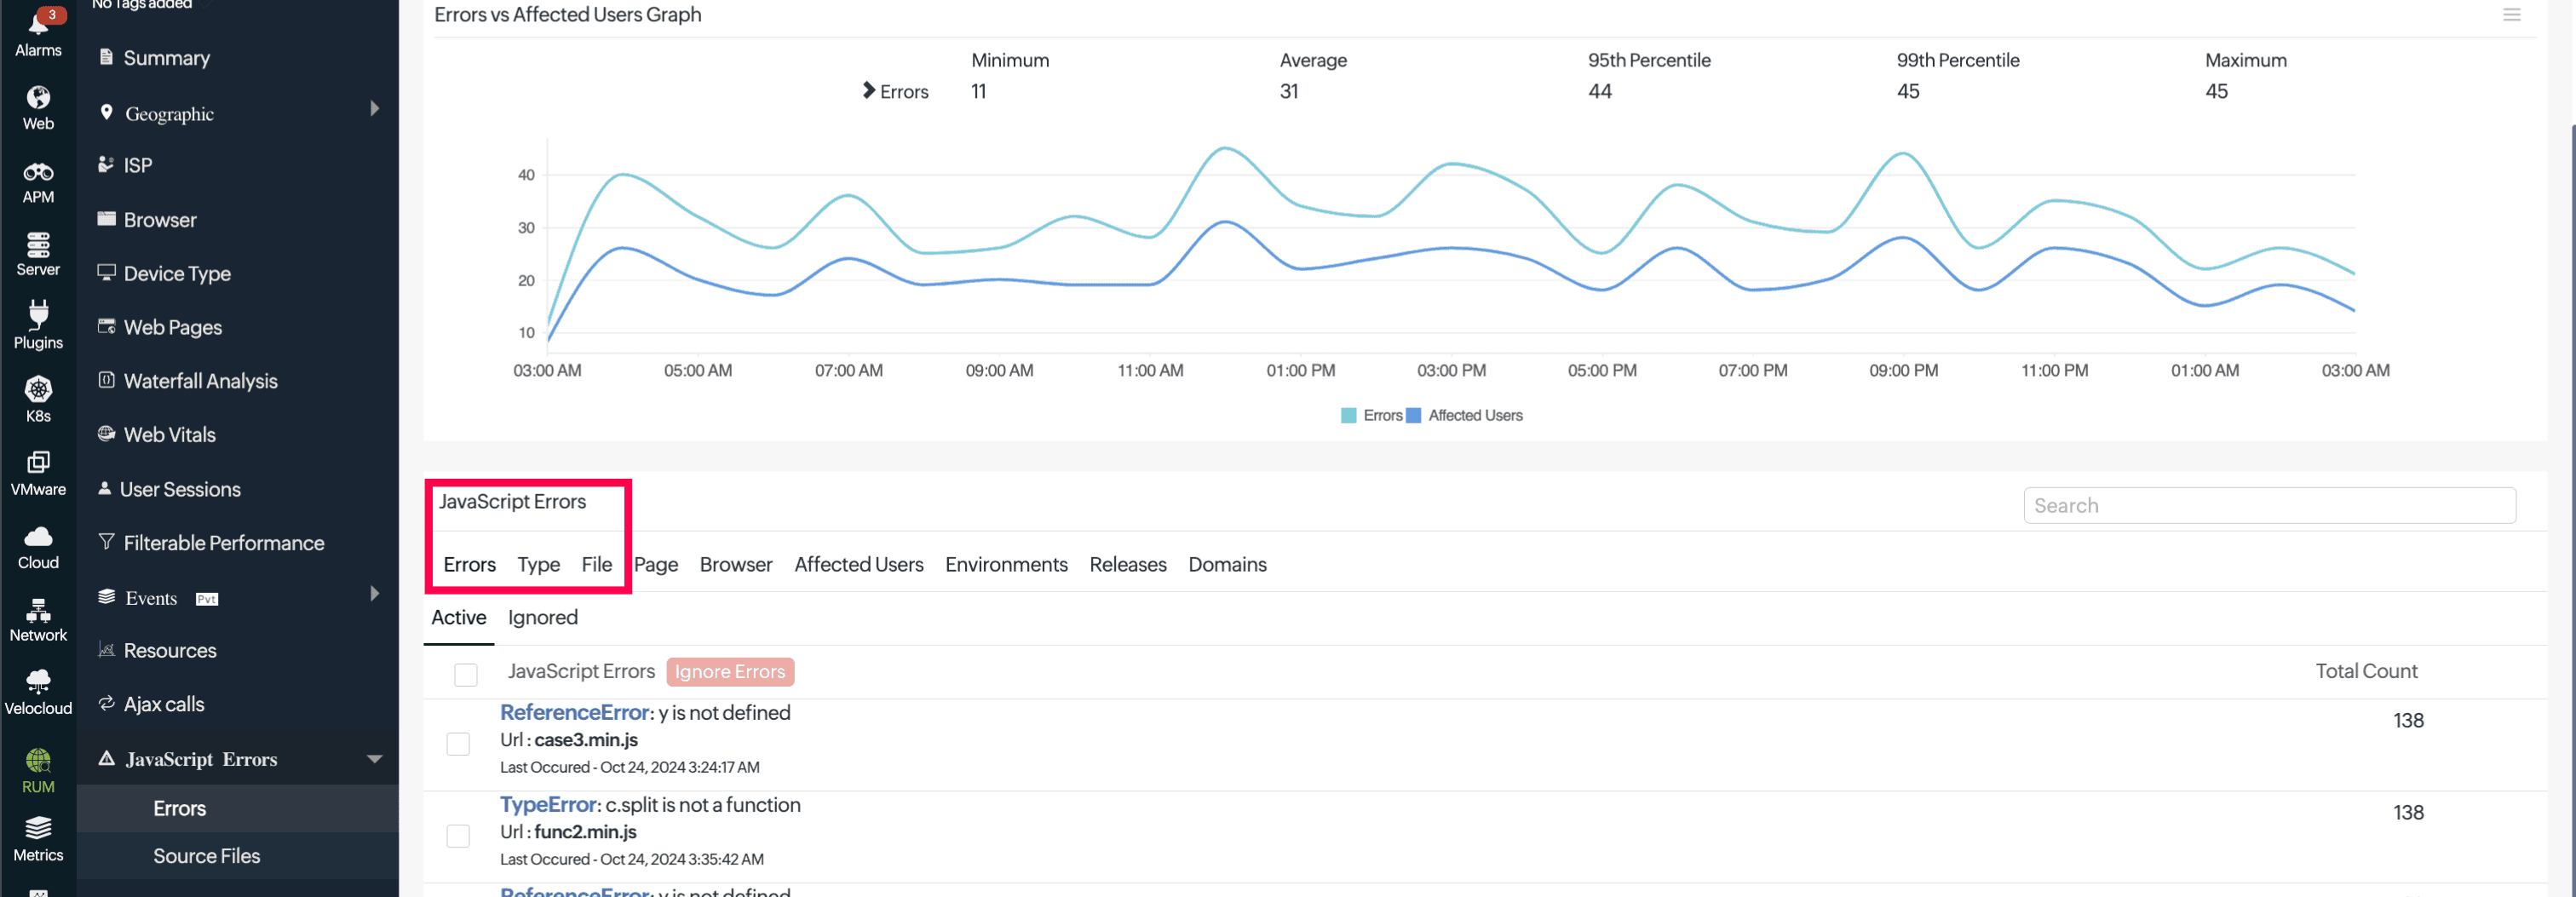
- Users of a specific device type encountered an average of 31 errors, significantly higher than the 17 average errors experienced by users of other device types.

Segmentation and analysis
The team filtered the data by the location and the device used to dive deeper into these findings. By isolating the data of US users and users of the particular device type, the team identified that a particular JavaScript library was responsible for the delays and errors.


Actionable steps
Armed with these insights, the Zylker team took the following actions:
- Optimized the script: Zylker collaborated with the library provider to address the performance issues and ensure better compatibility with the specific device type.
- Implemented a CDN: To improve response times for US users, Zylker integrated with a CDN to serve content more efficiently across regions.
- Conducted A/B testing: Zylker tested different versions of the site specifically for users of the affected device type, focusing on reducing response times and errors.
After implementing these changes, the e-commerce website saw a significant improvement in its performance metrics. Page response times for US users and the error rate for users of the specific device type decreased significantly. This not only improved user satisfaction but also led to a noticeable increase in the conversion rates of US users. By leveraging filterable performance analysis, the Zylker team was able to pinpoint issues affecting specific user segments and implement targeted solutions, ultimately driving better performance and user engagement.
By implementing RUM and leveraging filterable data, you can identify performance issues, enhance user experiences, and ultimately drive better outcomes. Stay vigilant about performance issues and achieve better results through filterable performance analysis. Gain complete visibility into your applications with Site24x7 and harness the power of RUM.
Topic Participants
Sindu Priyadharshini V