[New Features] Gain Deeper Visibility Into Application Performance by Tracking OpenTelemetry Metrics
Hi there!
We’re thrilled to announce our new features for OpenTelemetry: metrics and logs. Now you can capture metrics by building custom queries to monitor system performance, detect errors, uncover trends, and analyze logs in real time—all on one platform for complete observability.
What you can do?
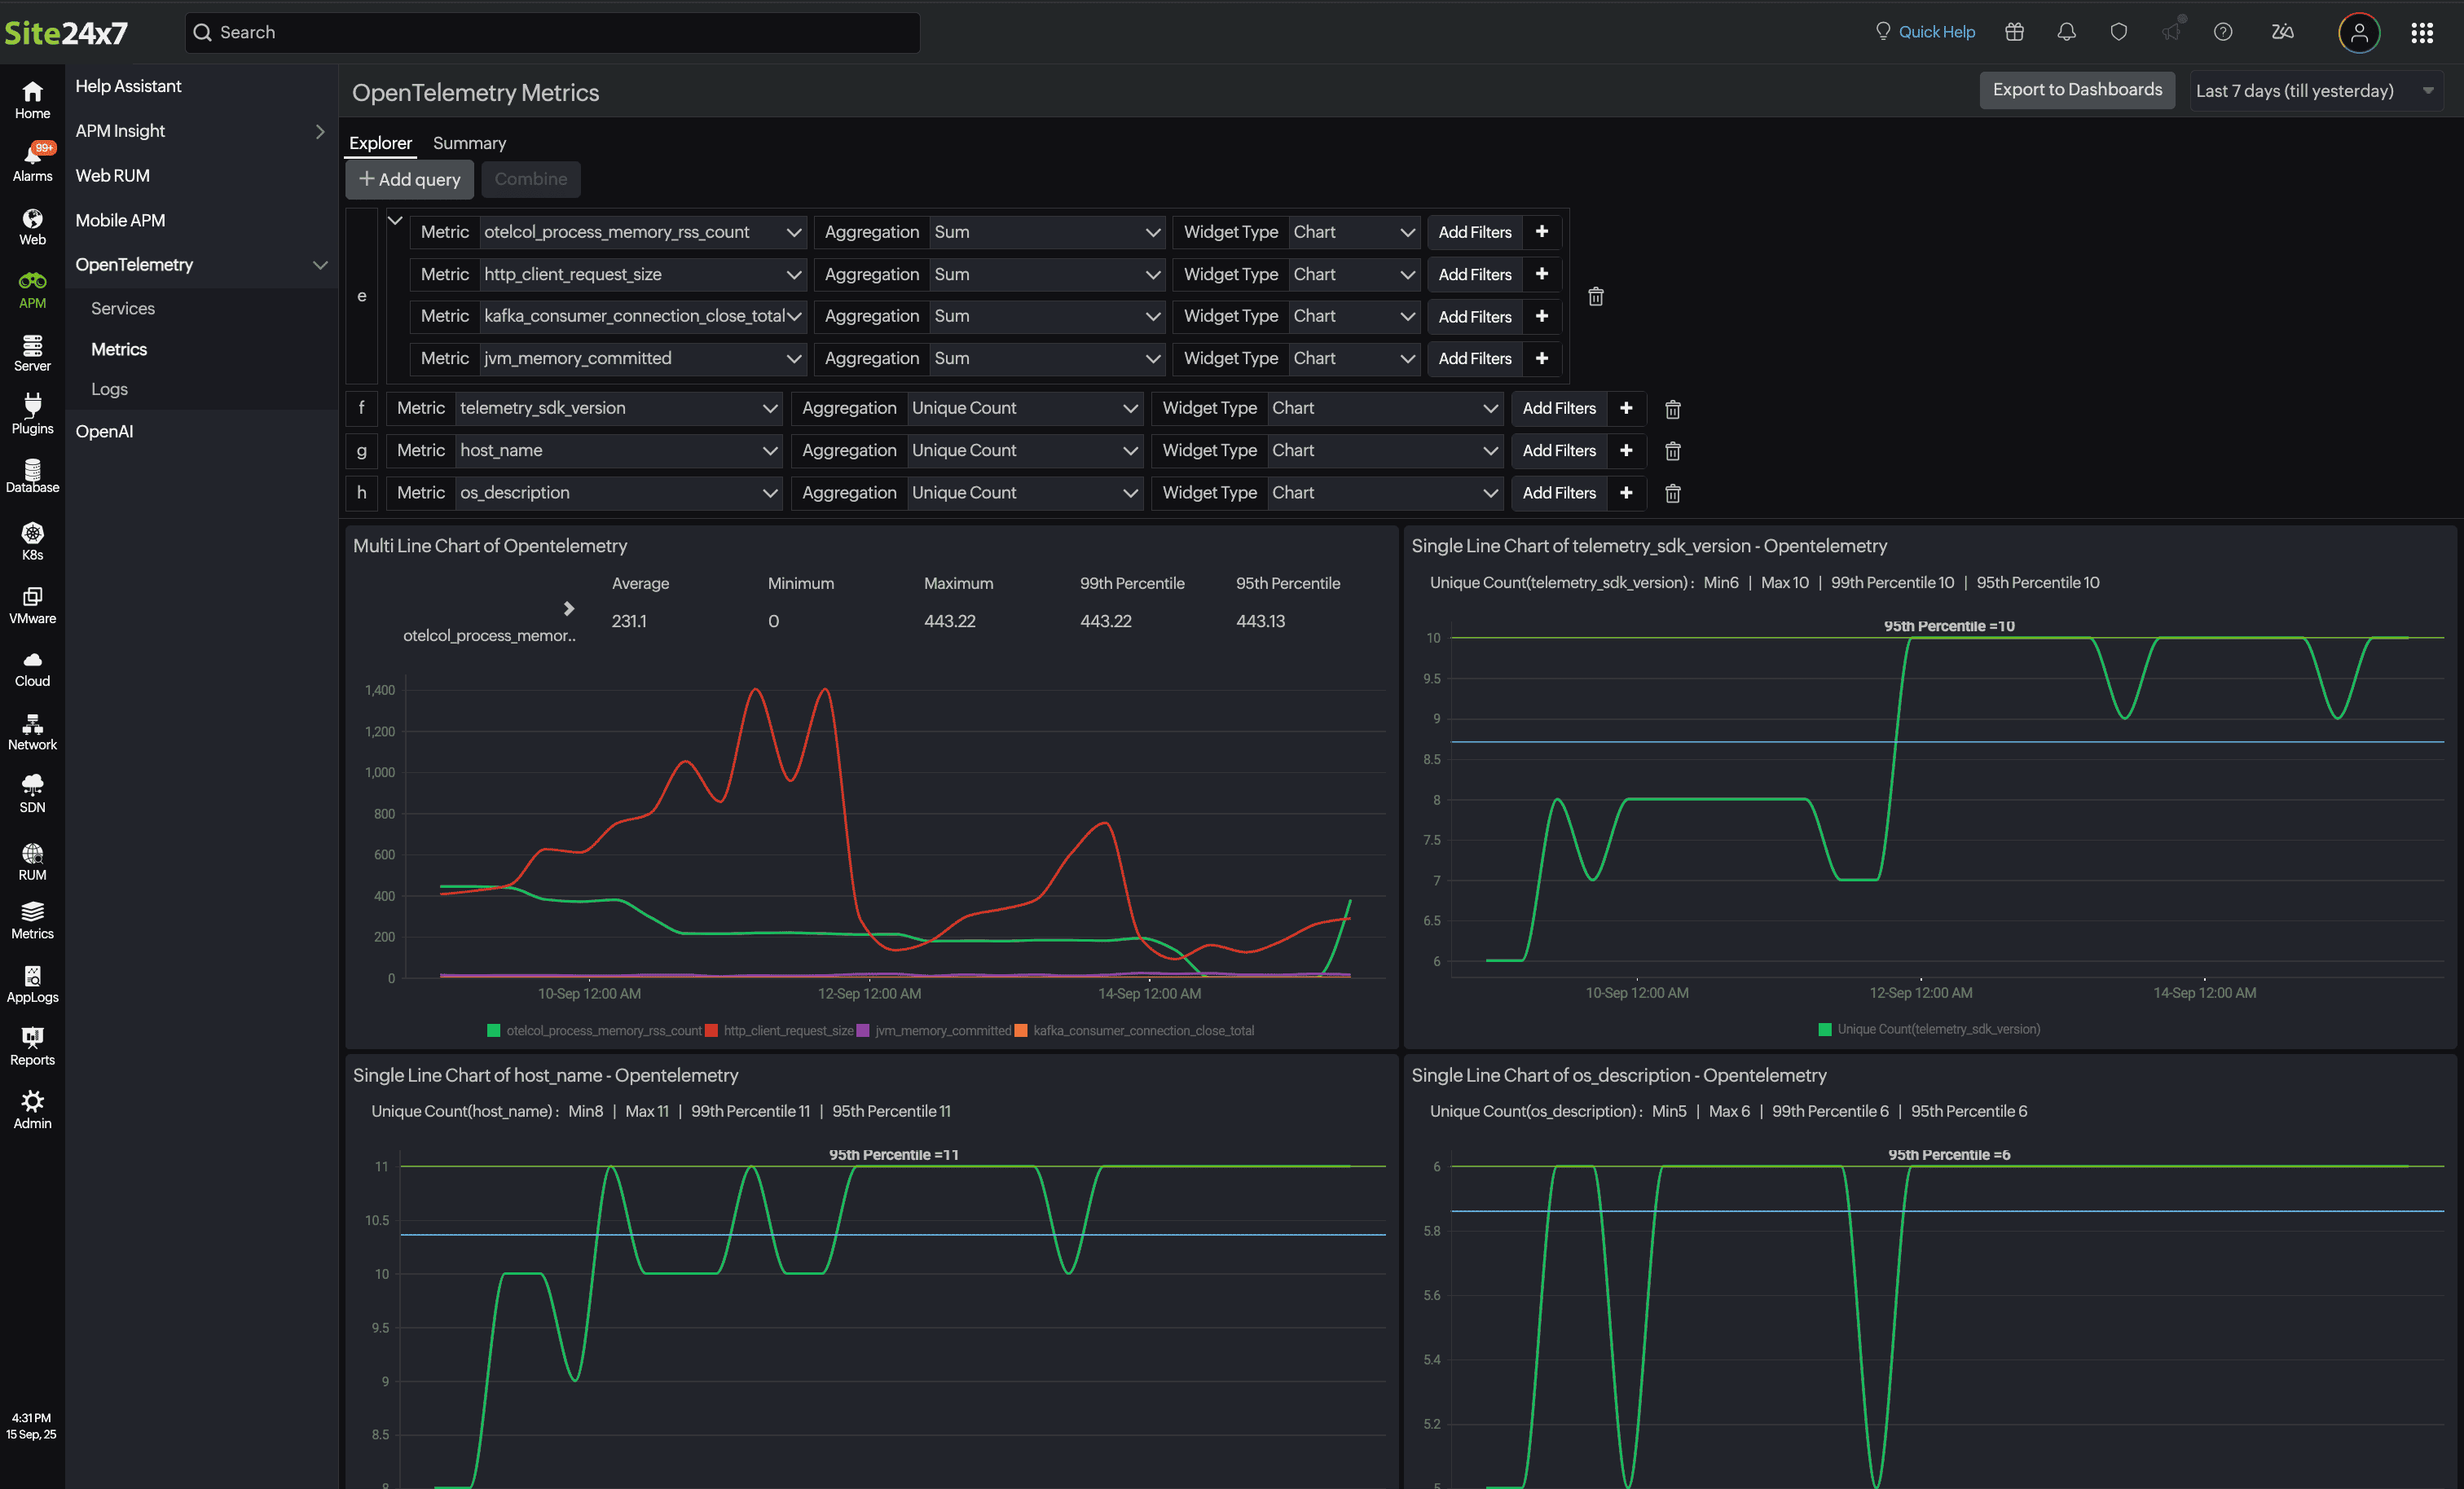
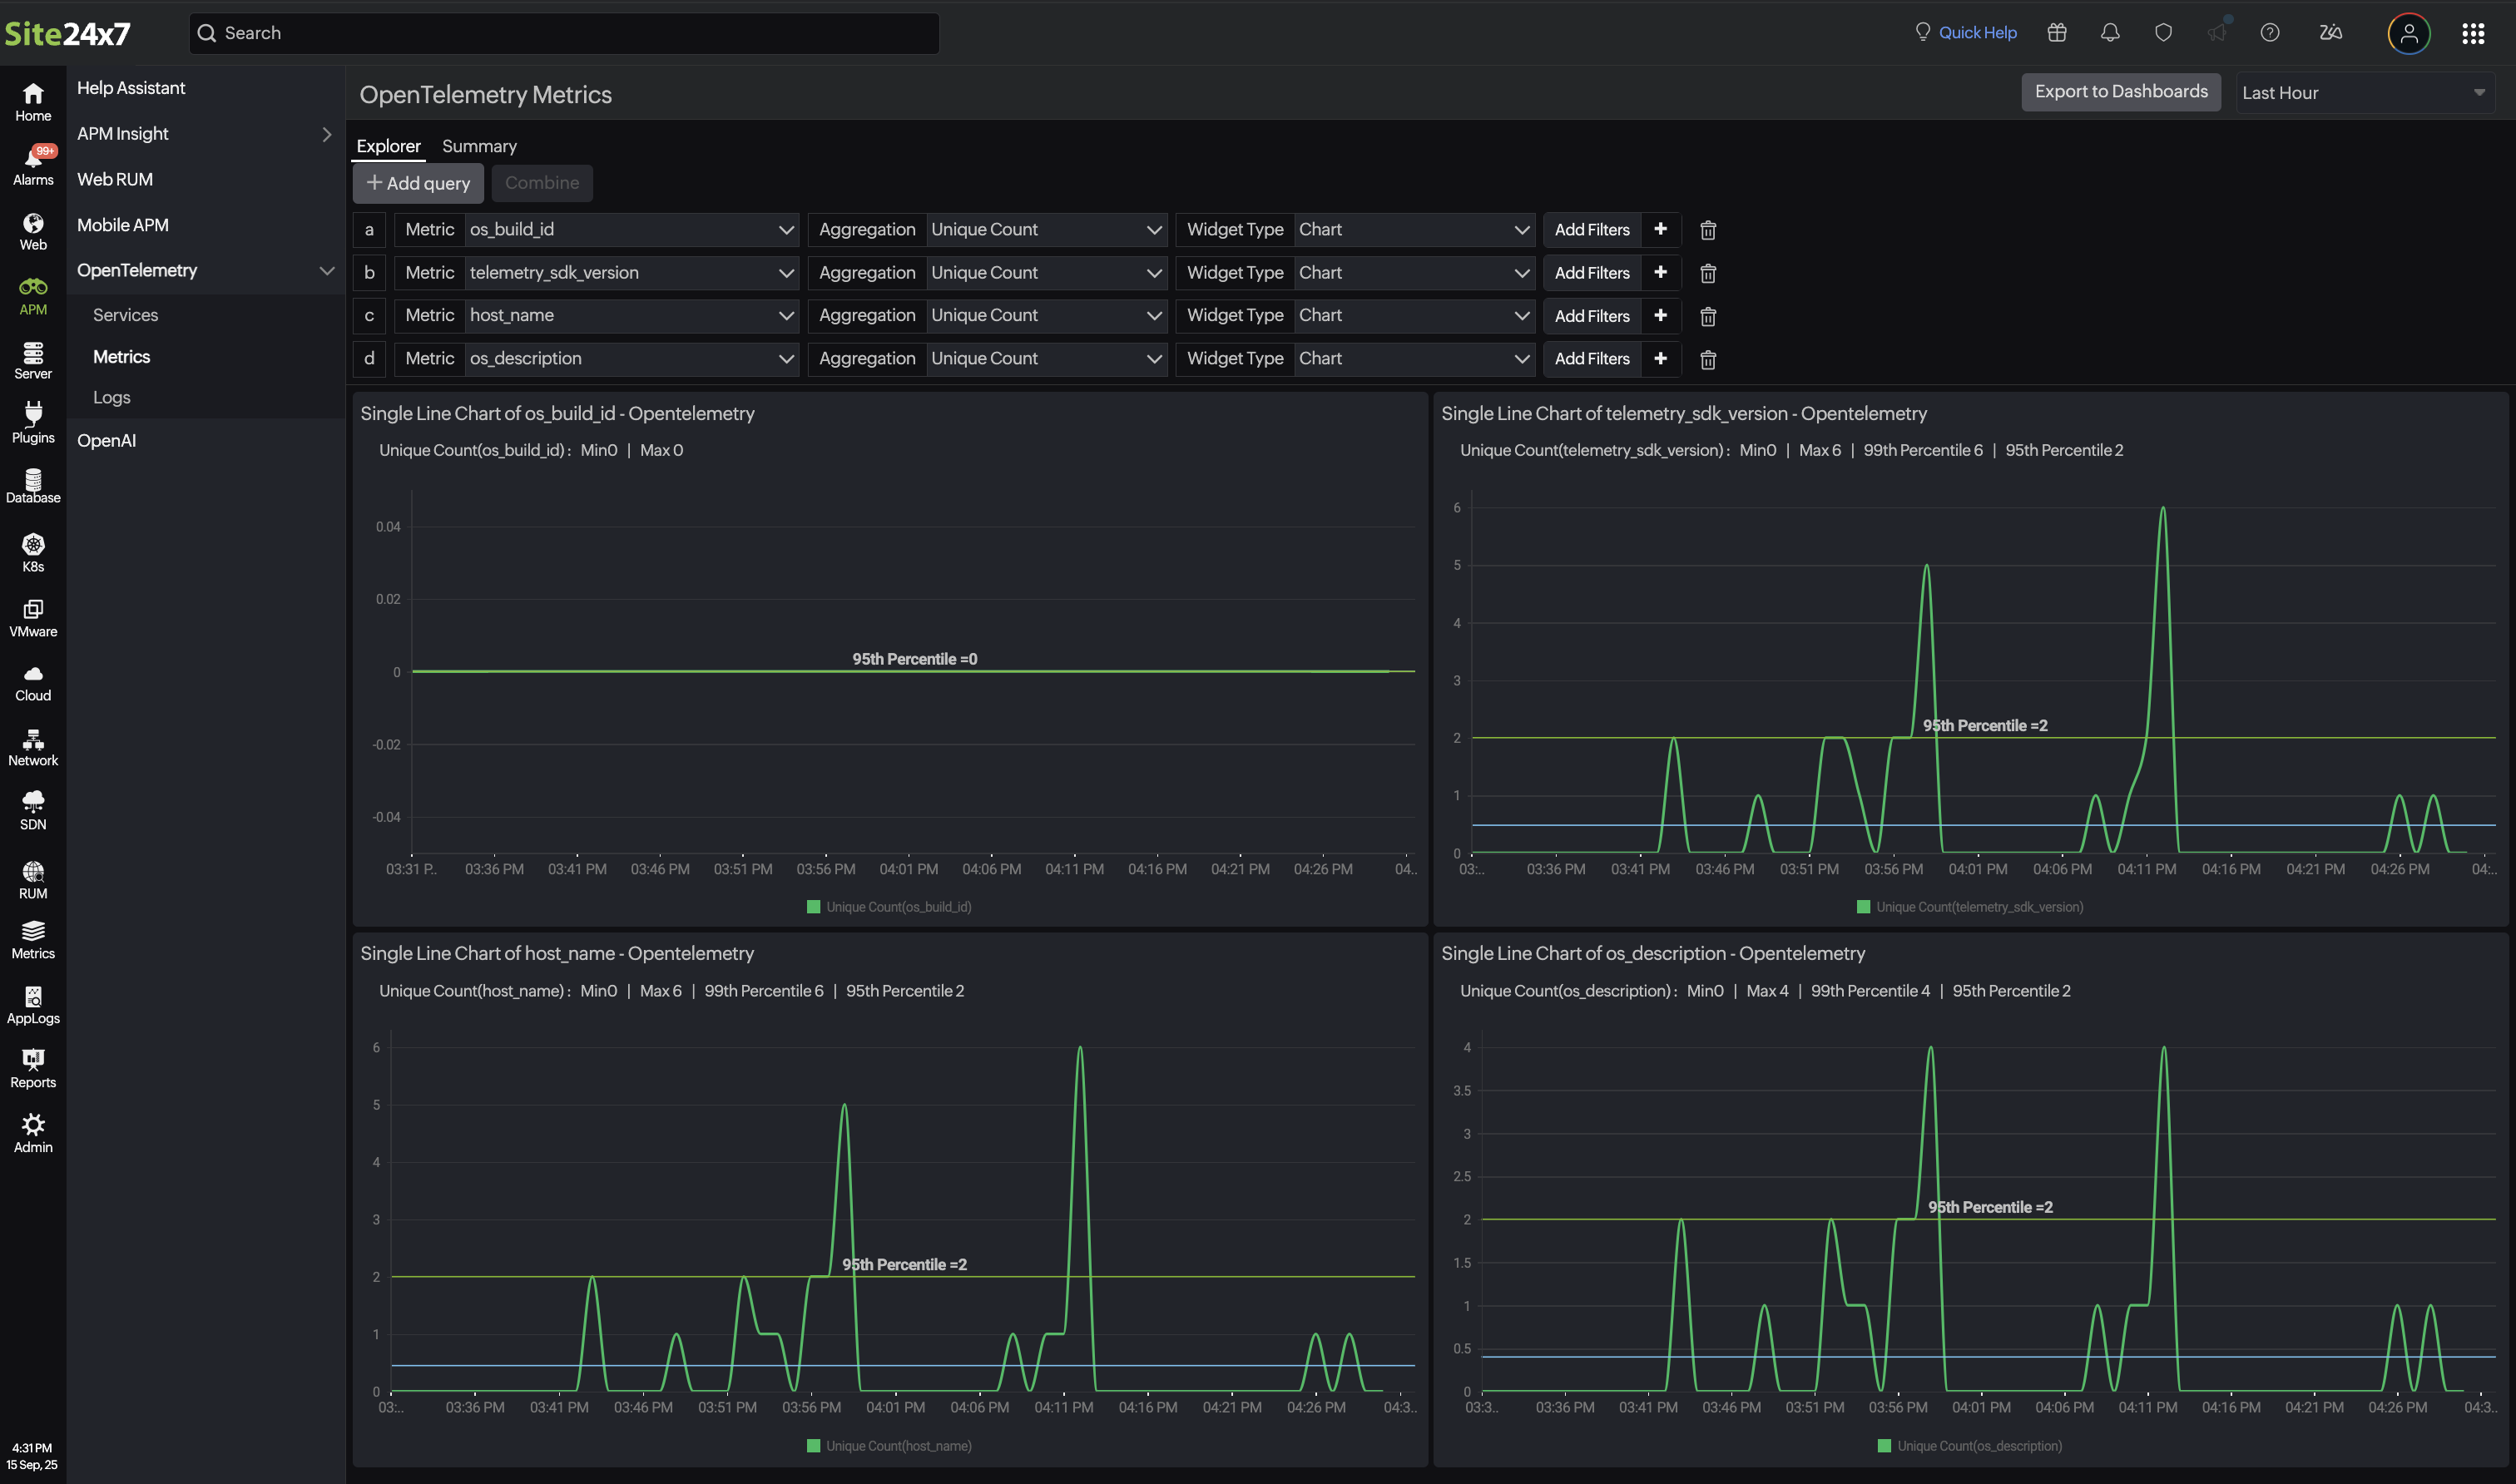
- Explorer: Build single-line or multi-line charts or number of the latency, and checkouts. Choose metric names and the Aggregation type and click Export to Dashboards in the top-right corner to add a new dashboard.
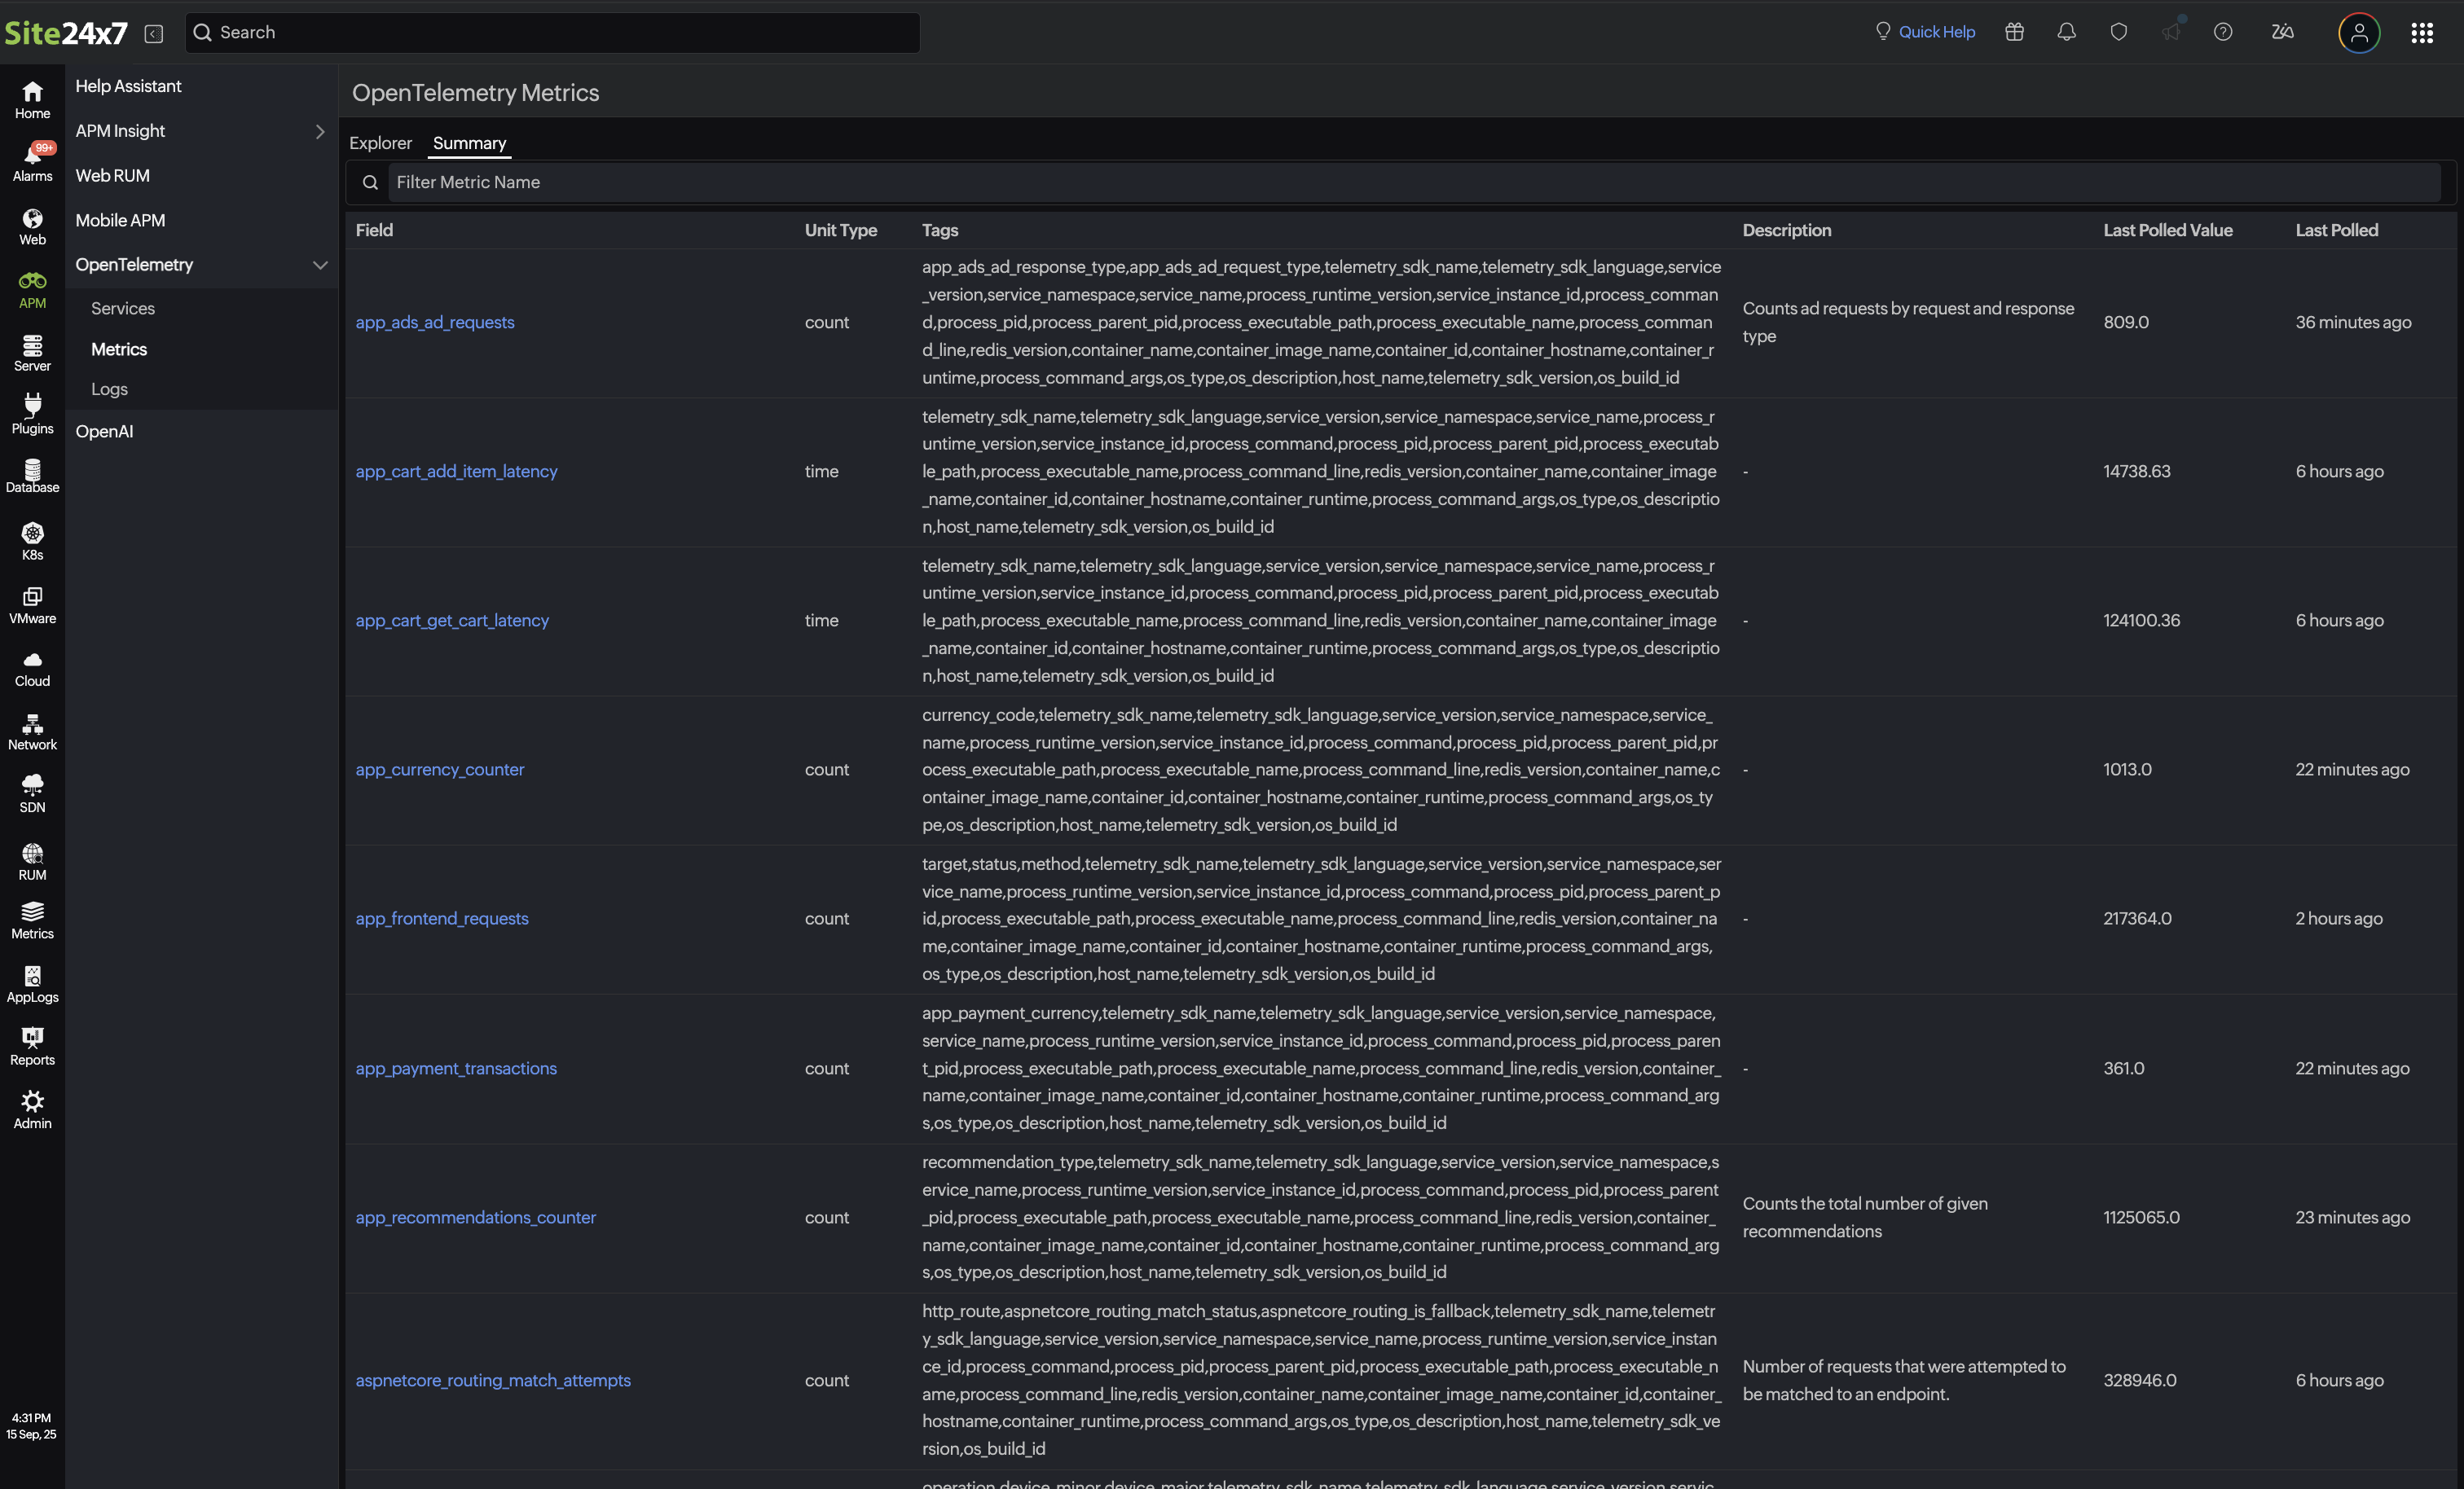
- Summary: Analyze every metric’s unit, latest value, and tags and when it was last polled. Click a tag to watch individual attributes update live.
Explore how it works, try our new OpenTelemetry metrics and logs today, and experience smarter monitoring and deeper insights firsthand.
Have any questions or feedback? Feel free to reach out to support@site24x7.com.
Until next time. Happy monitoring!
Topic Participants
Jenifer P