[New Feature] Build Custom Dashboards without any Additional Coding
Good day folks,
Custom Dashboard has always been one of the most sought-after product enhancements at Site24x7. Also, now with our renewed focus on Reporting and Dashboards, it was only a matter of time before the feature became a reality. We're excited to introduce to you our brand new Custom Dashboards -- A new way to build personalized and customizable dashboards, which can portray all your monitoring data in a single interactive view, all without any additional coding. So, without further ado, let's see what's new and exciting about Custom Dashboards.
Build Dashboard from the ground up using Dynamic Widgets
Site24x7 has been providing standard dashboard views and reports out-of-the-box. These views let you trace your monitoring trends and identify potential performance issues, in a matter of minutes. Now with the Custom Dashboards, we're giving you complete freedom and ability to build and design dashboards, which can portray critical monitor metrics for a relative time stamp of your choice.
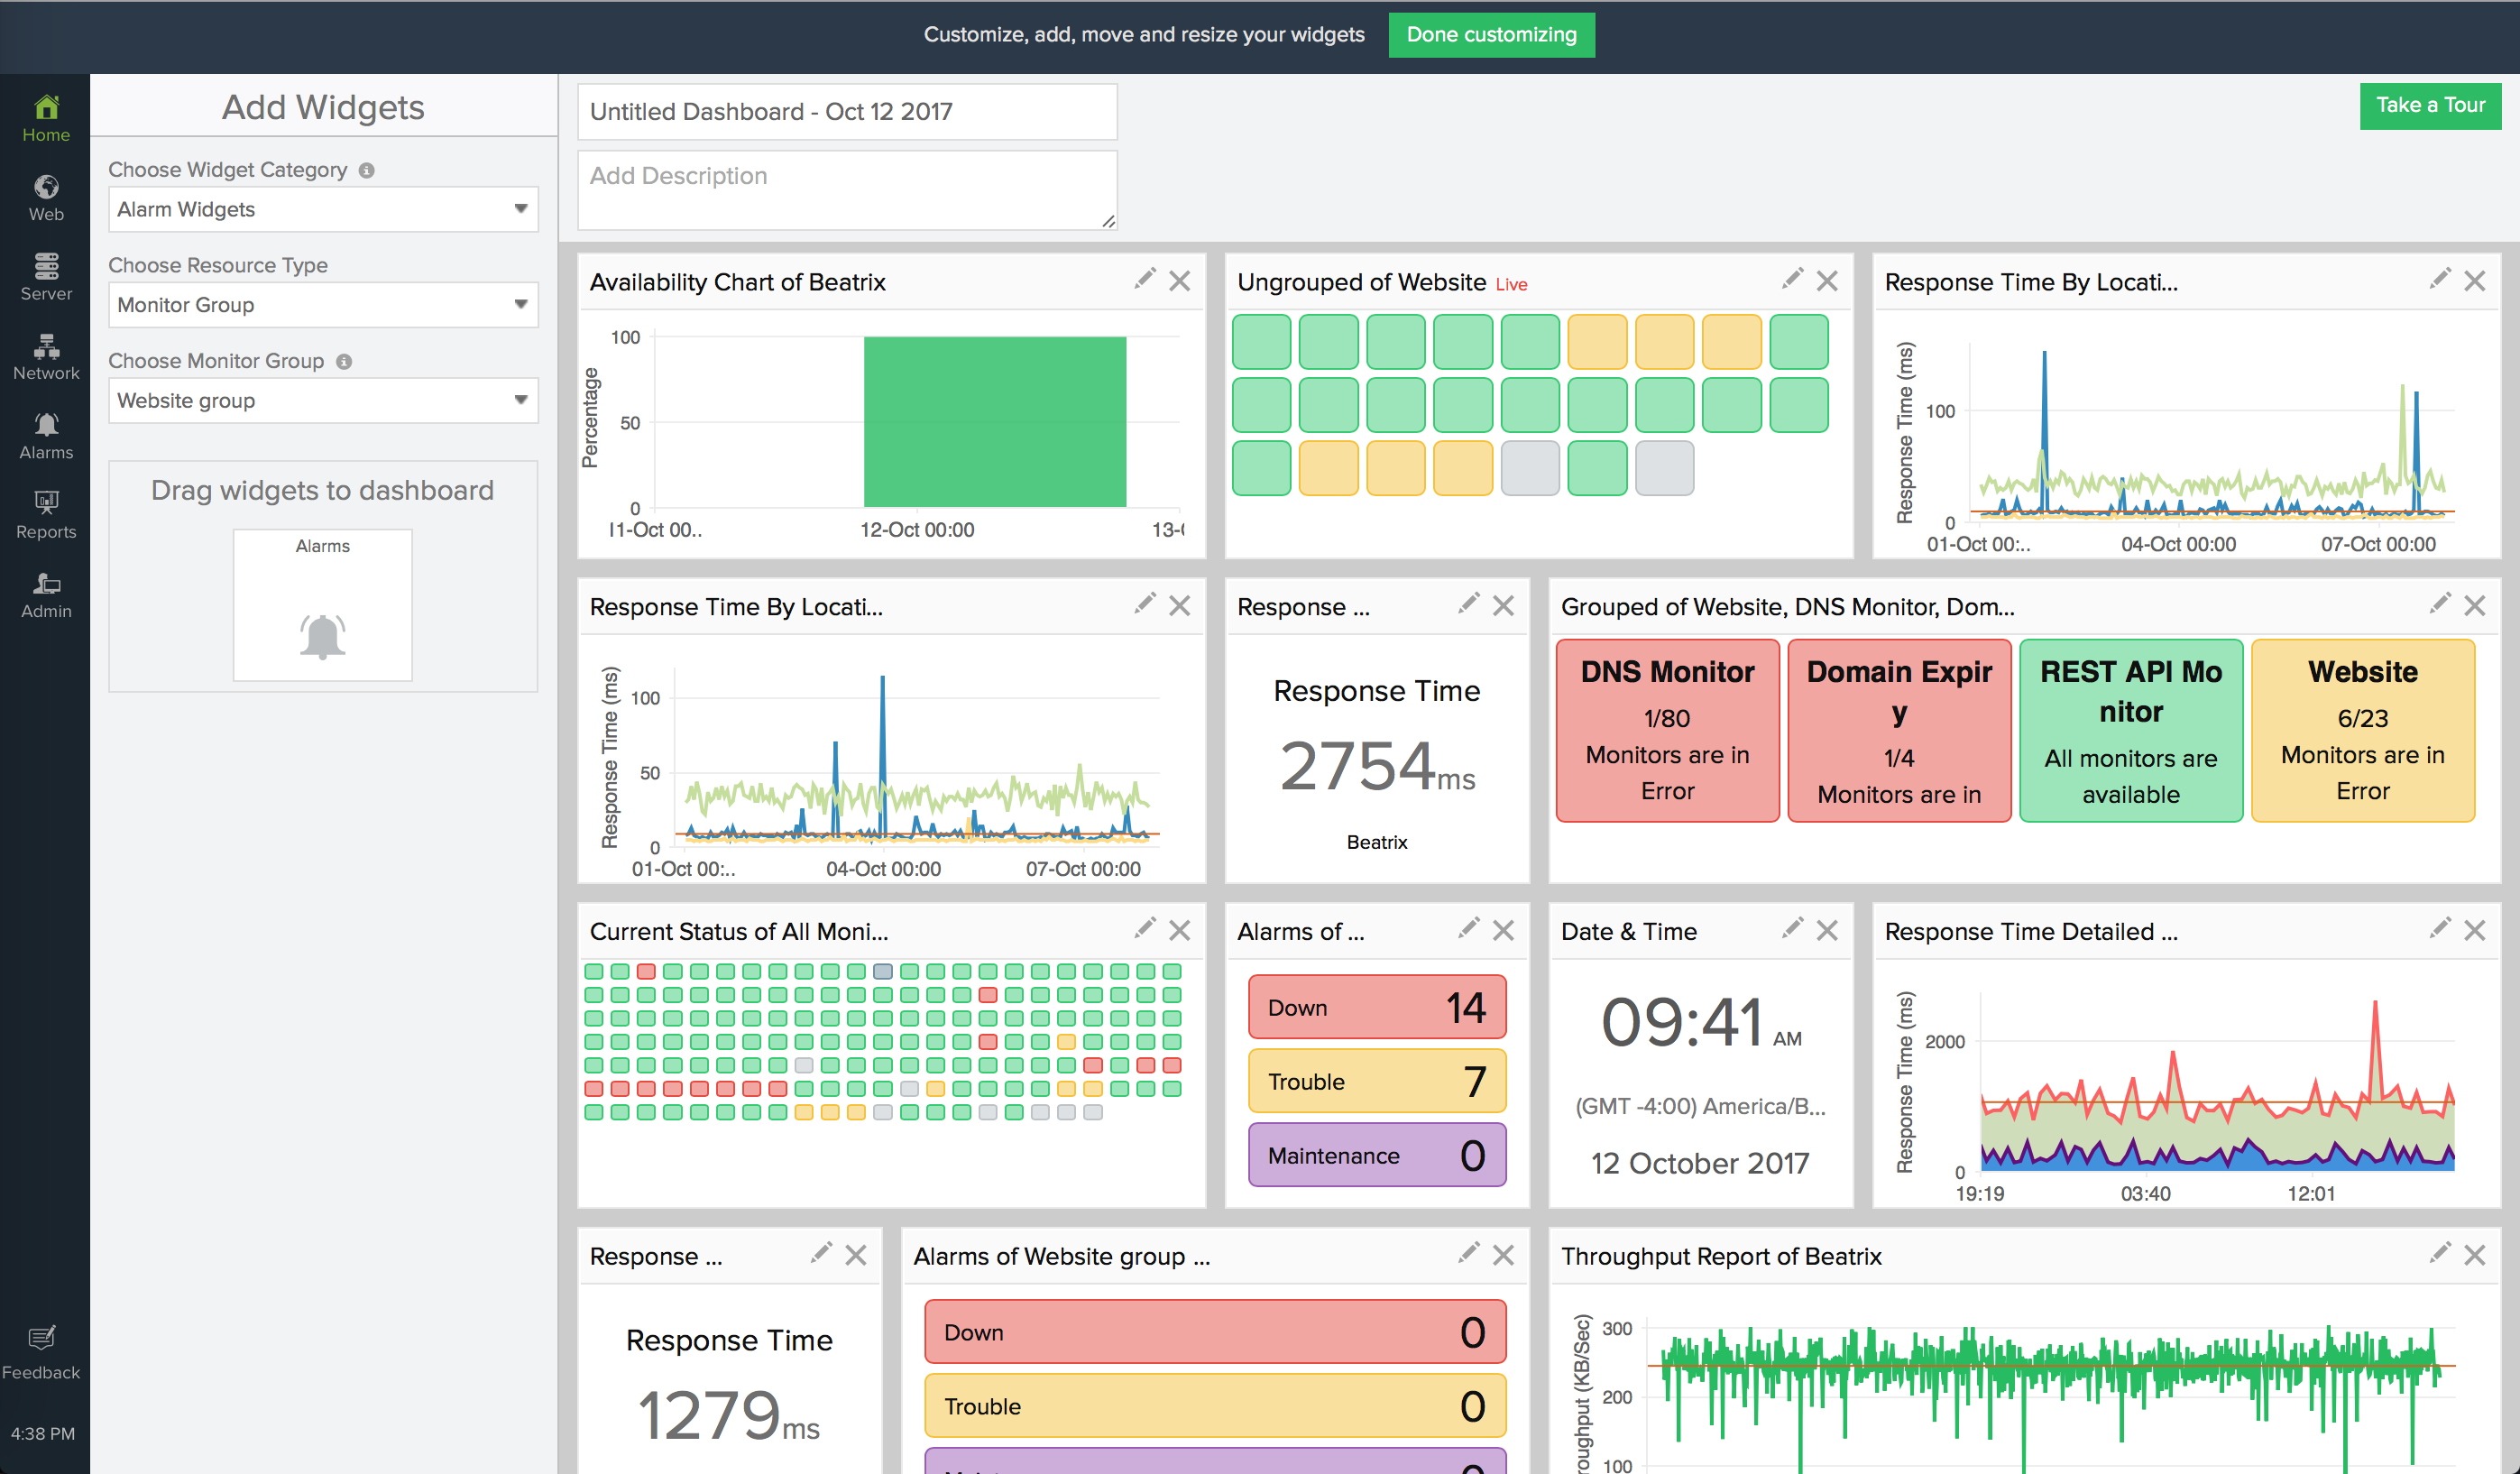
We have brought in a set of dynamic widgets that can render your monitor's availability and performance attributes in numerical and graphic charts inside the Dashboard grid. You can filter the widget category, pick the right attributes for your monitors, and select a time period of your choice; once done, drag and drop the widgets onto the Dashboard grid. You can pin up to 24 widgets on a single dashboard grid and create 20 such custom dashboards, in total.
Widgets Supported
We offer multiple widget categories, out-of-the-box. They're Performance widget, Availability widget, Current Status widget, Alarm widget and General widget.
- The Performance widget lets you render performance attribute data supported by your monitor. You can either pick a numerical view or a graphical view to display your data.
- Availability widget allows you to showcase the actual uptime of your monitor in an area graph for the time selected by you.
- The Current Status widget gives real-time monitor status data of your selected monitors. You can additionally filter resources based on their actual operational status. It portrays a mini NOC view of your monitors' status. If you've selected the resource by Monitor Group or Monitor Type, it allows you to show the monitors as a Grouped widget or an Ungrouped widget.
- Alarm Widget lets you showcase the Down, Trouble and Maintenance Alarms count for your selected resources in a single widget view. This widget, similar to the Current Status widget updates the data in real-time.
- On selecting the general widget category, you have an option to pick a Date & Time widget. The date and time widget will render the actual date and time at your preferred time zone. At present, this is the only widget in this category. However, we will add more such widgets over time.

Allow Custom Visualization of your Dashboard View
Our custom dashboards have been designed with the idea of simplicity in mind. The dynamic widgets allow you to manipulate the data being pumped through the Site24x7 servers and offer custom visualization of your requisite attribute data in a single interactive interface. You can edit, delete, resize and reposition a widget, once it's pinned onto the dashboard grid. You can render all your critical data across your IT infrastructure to fit on one screen, which may be Mobile, Tablet, Laptop or a mounted NOC Monitor view. The dashboard auto-updates every minute without the need for any third party tools to auto-refresh. However, you can always manually refresh the dashboard, if needed. In addition to all these features, the Day-mode and Night-mode themes can help you with a comfortable viewing experience round-the-clock.
Although the data gets rendered for a widget-level time selection, you can always override this setting with a global time selector button in the Dashboard View. You get to view the data in the widgets with a granularity of RAW, Hourly, Day or Weekly data when you select the time, viz., one day, one week, one month or even a custom date range.
Make Dashboard Public
Once you're done customizing your dashboard, you can instantly make the dashboard public by generating a permalink for the dashboard. It can then be embedded and shared across your customers or peers as a read-only dashboard. However, if you don't wish to share the dashboard view across, you can still extract the dashboard view as a PDF document and share with only the desired folks.
Roles and Permissions
All customers having a paid subscription plan gets to access Custom Dashboards. However, only a user with a Super Admin or Admin roles can Add/Edit/Delete the dashboard. Other sub-user roles like Operator, Spokesperson, and the Read-only user will be able to view the Dashboard and widget data only if sufficient privileges are extended. To know more about this, check out our roles and permissions document.
Help Resources
Learn how to set-up Custom Dashboards for your monitoring needs.
We look forward to enhancing and refining our Custom Dashboards feature as we move on. So, start building your first custom dashboard now and feel free to share your valuable feedback and suggestions here.
Topic Participants
Tekservicios