Monitor custom Postgres database queries with plugin integration
We are excited to introduce a new plugin integration to monitor custom queries in your PostgreSQL database.
With the Postgres custom query plugin, you can:
- Keep track of business-critical KPIs by monitoring SQL queries such as those based on user engagement, sales and revenue, customer satisfaction scores, payment gateway response times, failed transactions, and so on.
- Detect issues with application performance by monitoring query execution times.
- Receive alerts based on thresholds when specific query outputs exhibit inconsistencies or unexpected changes, enabling you to stay on top of critical events.
- Configure your query in the plugin to track any query that is vital to your business by utilizing different attributes to generate events.
Here are a few examples of how you can benefit from monitoring specific queries from your Postgres database:
- Monitor specific cell values in tables that are critical to your business—such as those related to product sales orders, customer purchase rates, and ticket resolution times—and receive alerts if they surpass predefined limits.
- Failed queries can often indicate underlying database or application issues. You can configure the plugin to receive alerts when queries fail and take swift action to identify and fix the underlying issue.
- Enhance user experience by proactively addressing increases in query response times.
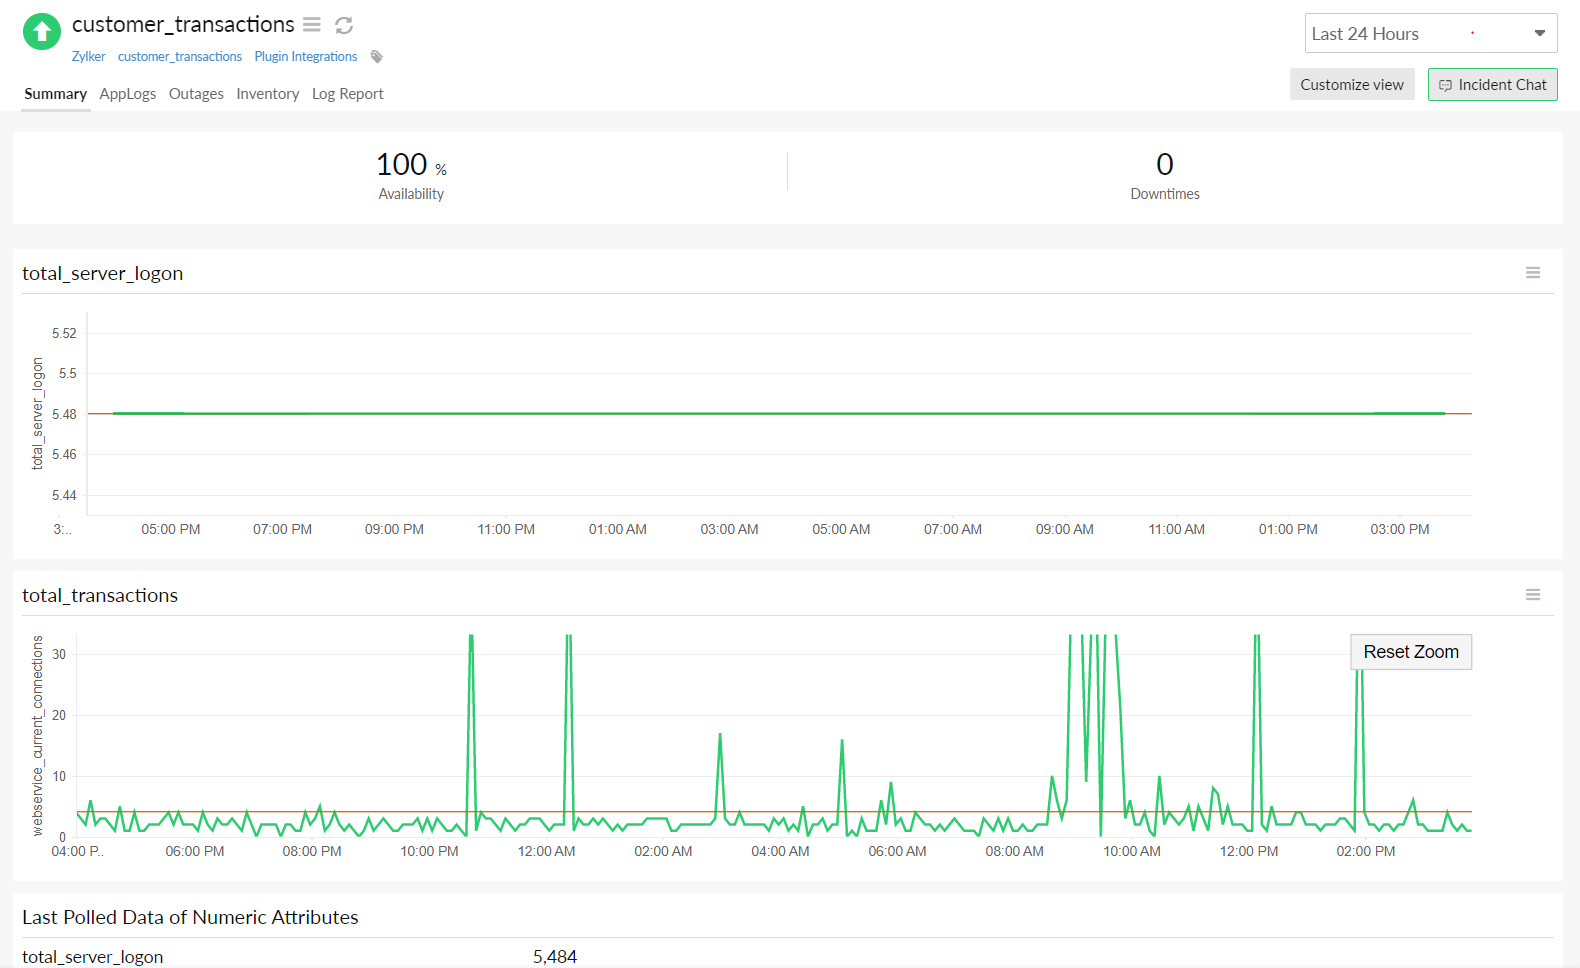
Follow the steps in the GitHub README file to install the Postgres custom query monitoring plugin integration and monitor any query in your PostgreSQL database. After installing the plugin, log in to the Site24x7 web client and navigate to Plugins tab from the left nav to view the data.
Check out our growing list of more than 100 plugin integrations to monitor your entire application stack.
You can also build your own plugin in Linux or Windows to monitor any custom application, system, or service in your server.
Contribute your custom plugin on any technology for Site24x7 users and get a chance to win a gift voucher.
Happy monitoring,
The Site24x7 team
Topic Participants
Sinjan Ballav