Plugin integration to monitor MS SQL custom database queries
Greetings!
We are excited to introduce a new plugin integration to monitor custom MS SQL database queries.
The new MS SQL custom query plugin enables you to:
- Monitor SQL queries to track business-critical KPIs from your MS SQL database tables, such as those based on user sessions, payment gateway response times, failed transactions, and more.
- View trends in database connectivity to optimize application performance.
- View data outputs of critical events, and receive threshold-based alerts when a specific query output experiences inconsistencies or unexpected changes.
Configure this plugin to track any query that is critical to your business by using different attributes to generate events.
A few examples of how you can improve experiences or troubleshoot issues by using specific attributes are given below:
- Identify potential issues with the database or underlying application: Receive alerts when a query is unsuccessful, which can indicate an issue with the database or the underlying application.
- Identify overutilization of resources: You can monitor a query that fetches the number of records or rows in a table, and get notified if it exceeds a predefined limit. If a critical table receives an abnormally high number of rows, it could lead to overutilization of resources when fetching data from the table.
- Improve user experience: Take preventative measures when query response times increase and ensure optimal user experience.
- Track key performance indicators: Monitor the value of a specific cell in the table related to any KPI, such as number of product sales orders, customer purchase rates, or location-based customer access count during peak times, and get alerted when they breach predefined limits.
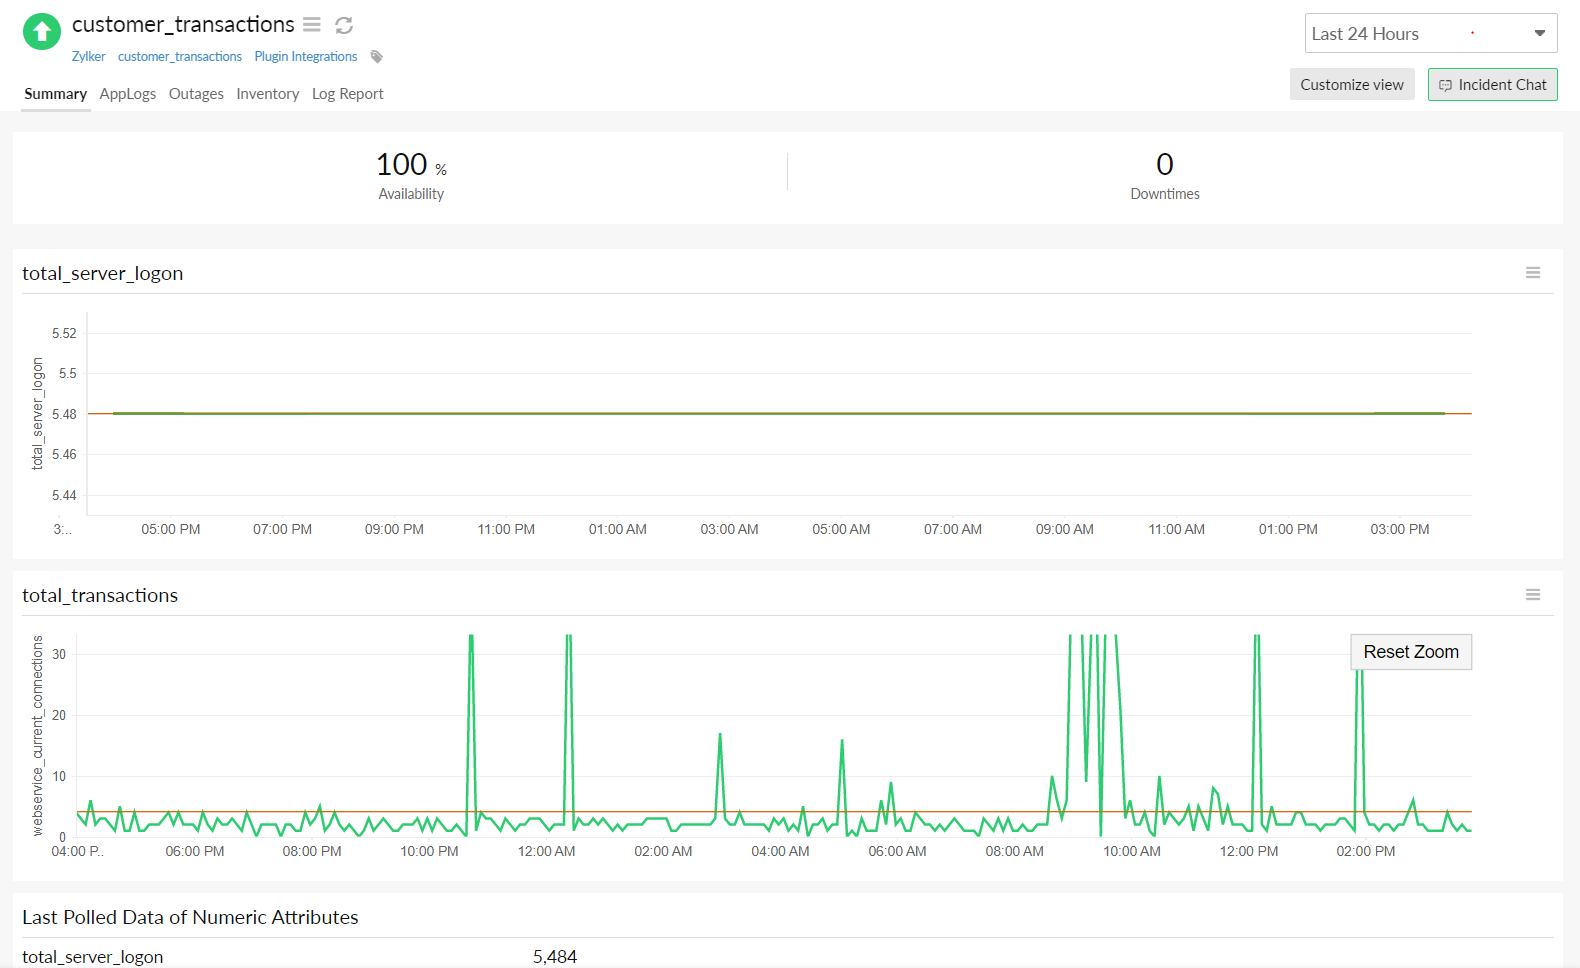 A graphical representation in the Site24x7 web client of the output of an MS SQL custom query demonstrating total logins and total transactions from an MS SQL DB table.
Follow the steps in the README file to install the MS SQL custom query monitoring plugin integration and monitor any query in your MS SQL database. After installing the plugin, log in to the Site24x7 web client and navigate to Plugins to view the monitored data.
We encourage you to check out our growing list of more than 100 plugin integrations to monitor your entire application stack.
You can also build your own plugin to monitor any custom application, system, or service in your server.
Watch the video below to learn how to add a custom plugin for Linux servers.
Watch the video below to learn how to add a custom plugin for Linux servers.
Until next time, happy monitoring!
Topic Participants
Sinjan Ballav