[New Feature] Memory Leak Detection in Site24x7 APM Insight
We are pleased to announce that our new feature, Memory Leak Detection in Site24x7 APM Insight, is available for general use.
That's right, detecting memory leaks in your Java application is now simple!
With the Site24x7 Memory Leak Detection feature, you can:
- Identify and address memory leaks before they seriously affect the performance of your application.
- Know exactly how much memory each of your Java collections uses.
- Spot the root cause of memory leaks by tracking the growth of the objects in collection over periods of time.
What are memory leaks, and how do they occur in an application?
Memory leaks occur in an application when memory resources are allocated but not properly released once they are no longer required. This frequently happens as a result of poor coding practices. Memory leaks are a killer of long-running applications because memory usage grows until the memory supply is exhausted, then performance begins to decline.
Symptoms of a memory leak in your application
There are a few symptoms that your Java application may be experiencing memory leaks:
- When an application continues to process requests for an extended period of time without releasing memory resources that are no longer needed.
- An OutOfMemoryError heap error has occurred in the application.
- Unusual and unexpected application crashes.
- The application occasionally runs out of connection objects.
How can you identify a memory leak?
With On-Demand Memory Profiling, you can quickly identify the objects (collections and maps) in your code stack that consume the most memory. You can find the Initiate Memory Profiling button under the JVM tab > Memory Leak Detection tab.
Note: You can customize the profiling as required by specifying the time duration.
Once the On-Demand Memory Profiling process is completed, all objects collected during the specified time are listed along with the associated metrics.
If any of the memory objects has a leak, you can drill down deeper into it by clicking on the respective record to identify the actual cause of the memory leak.
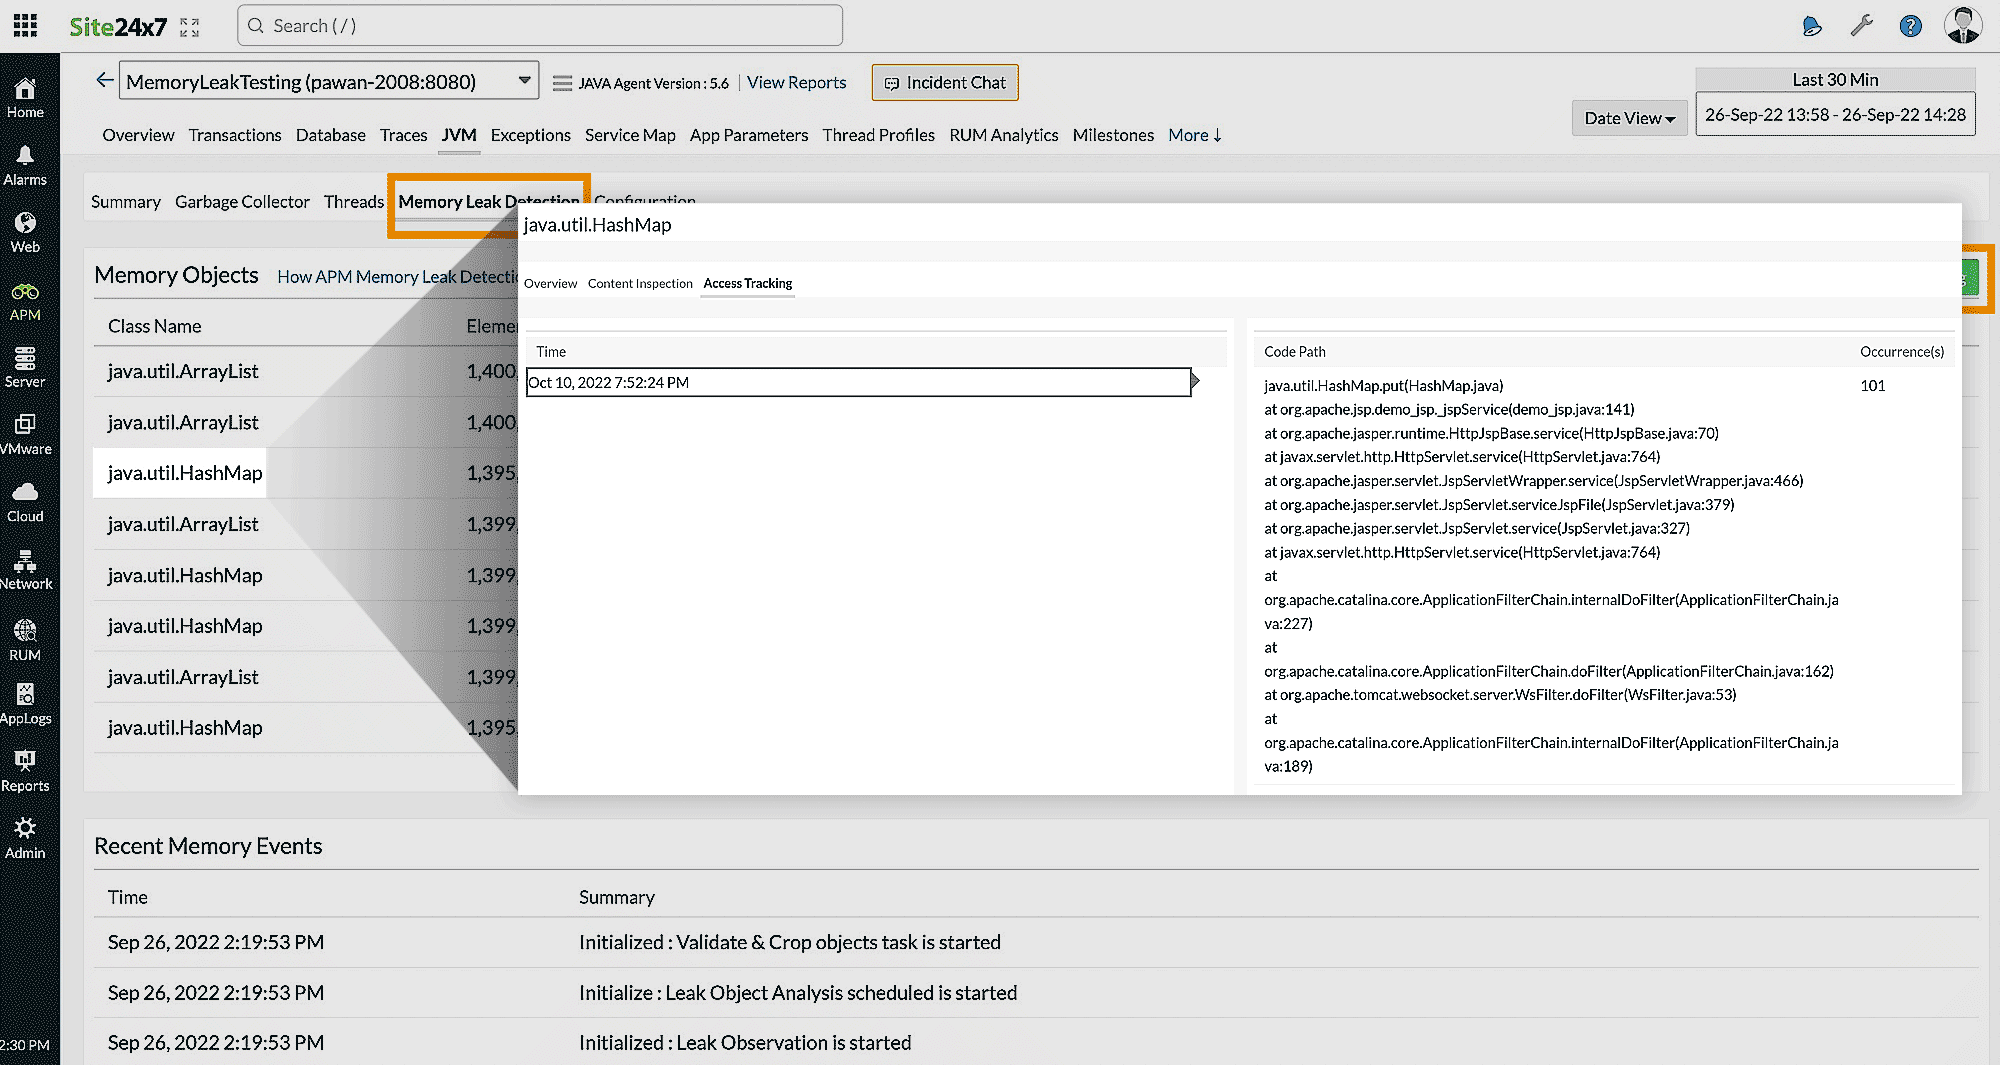
To troubleshoot and prevent similar memory leak issues, you can use:
- Content Inspection: This tab tells you what data the collection object is holding in the application so that you can begin troubleshooting. It allows you to keep track of the histograms of all the elements in a specific collection.
- Access Tracking: This tab displays the actual code paths that access the collection object.