Make informed decisions and troubleshoot faster with enhanced Custom Dashboard features
Unlock deeper insights and boost performance with the advanced dashboard widgets.
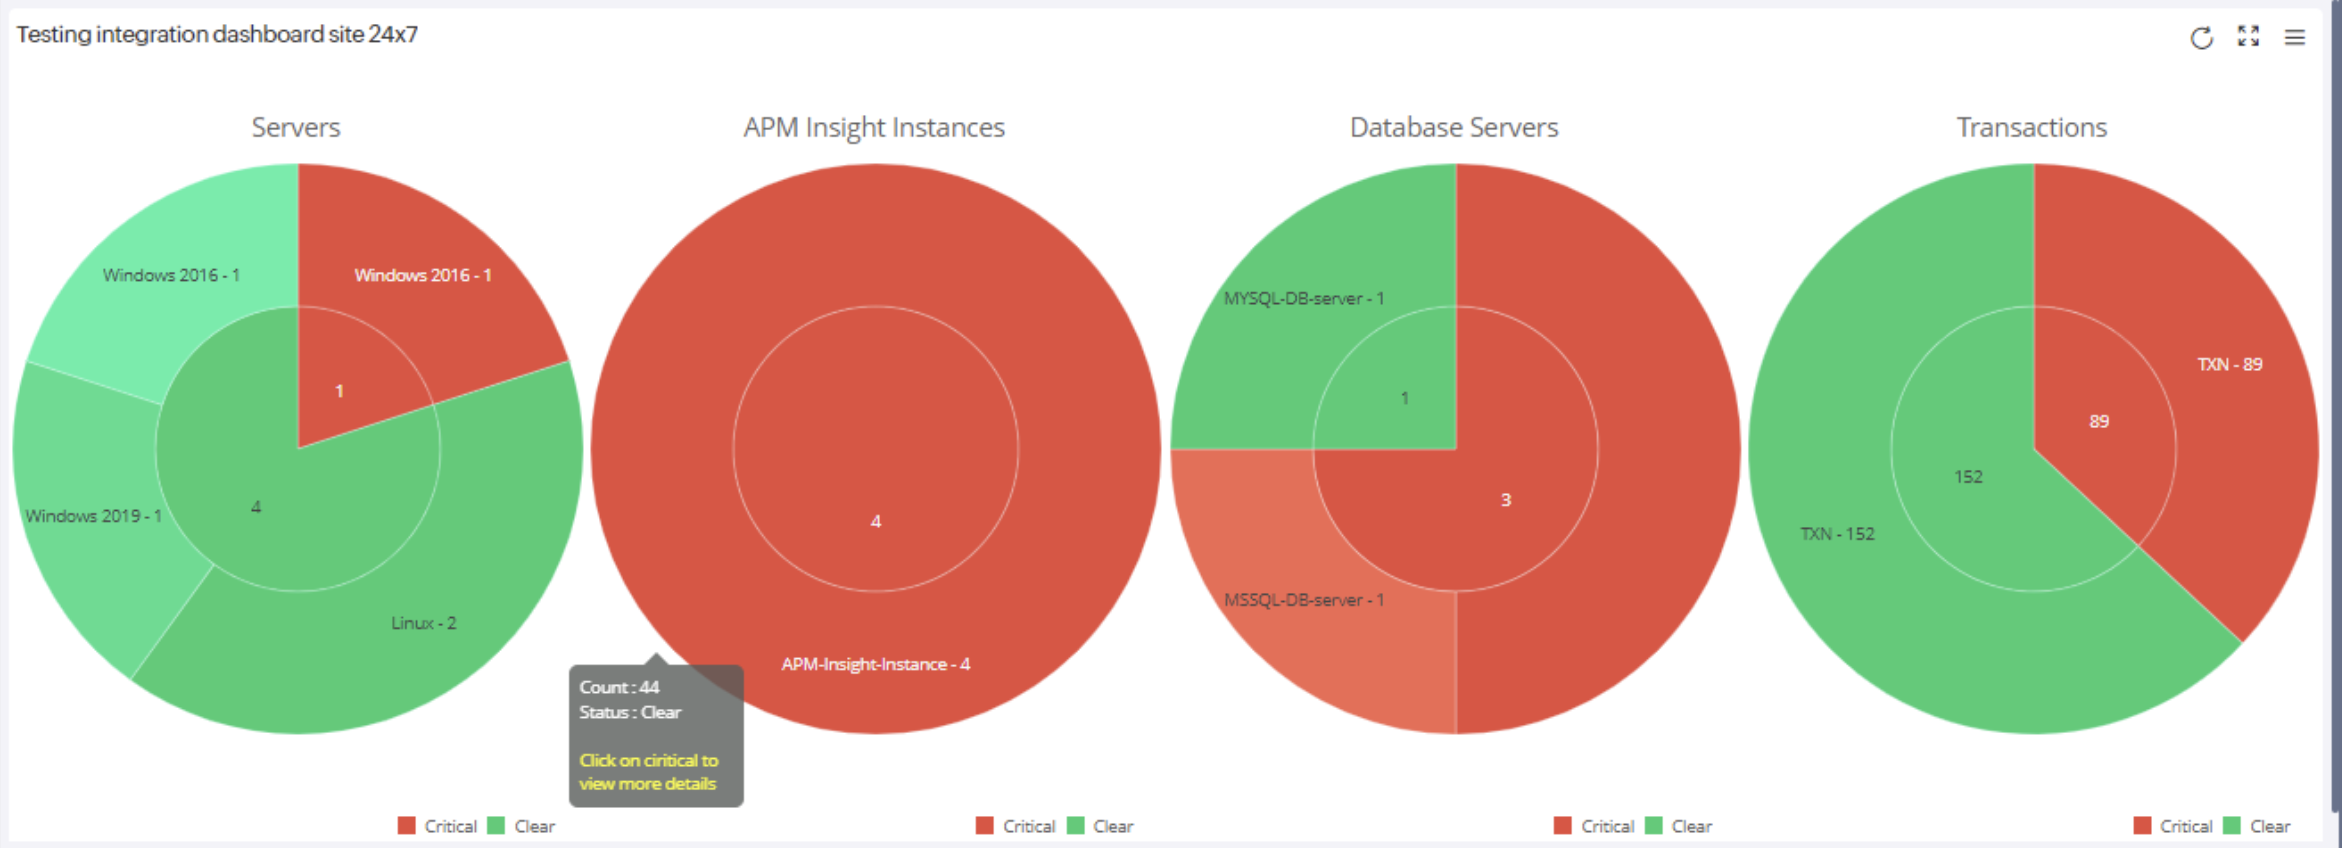
Gain real-time updates on critical and clear events of the application with the Application Errors widget across multiple components of an application. For example, DevOps engineers monitoring an e-commerce app can track key components like servers, databases, and transactions. They can drill down into server statuses—such as clear and critical—to identify and resolve issues quickly, ensuring minimal downtime.
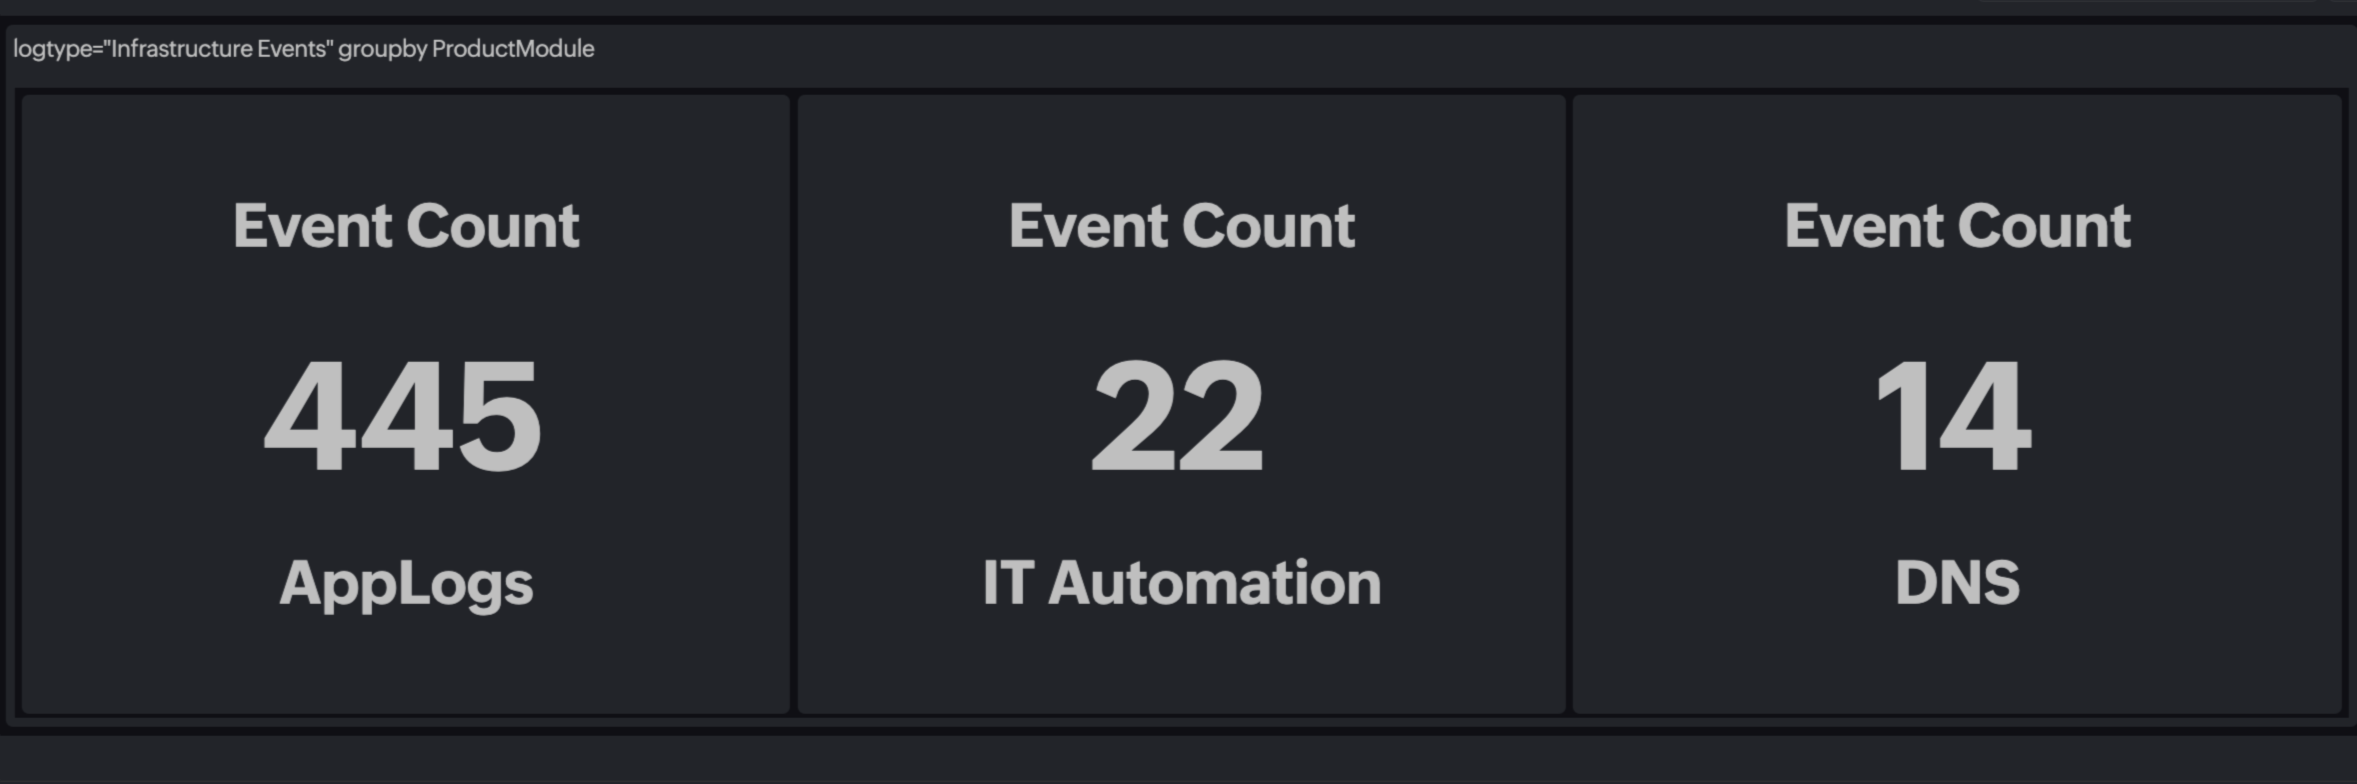
View the total number of infrastructure events recorded based on your query using the Events widget. You can retrieve up to six infrastructure events, grouped by monitor groups, using the following query:
logtype="Infrastructure Event" groupby MonitorGroups limit 6
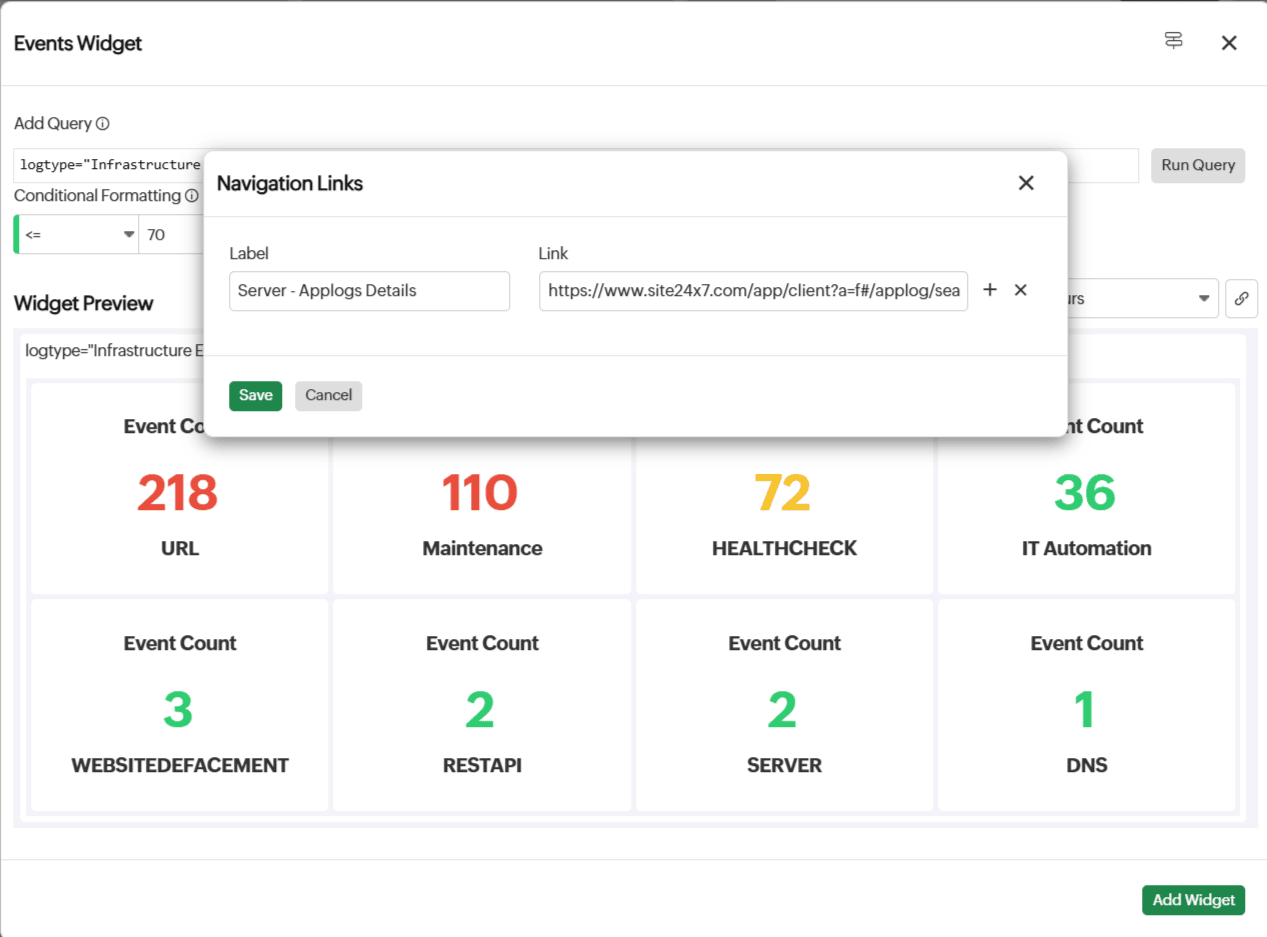
Additionally, manage breaches in event thresholds more effectively by using color-coding through Conditional Formatting. For example, you can configure the widget to display:
- Green for fewer than 10 events
- Yellow for events between 10 and 50
- Red for events exceeding 70
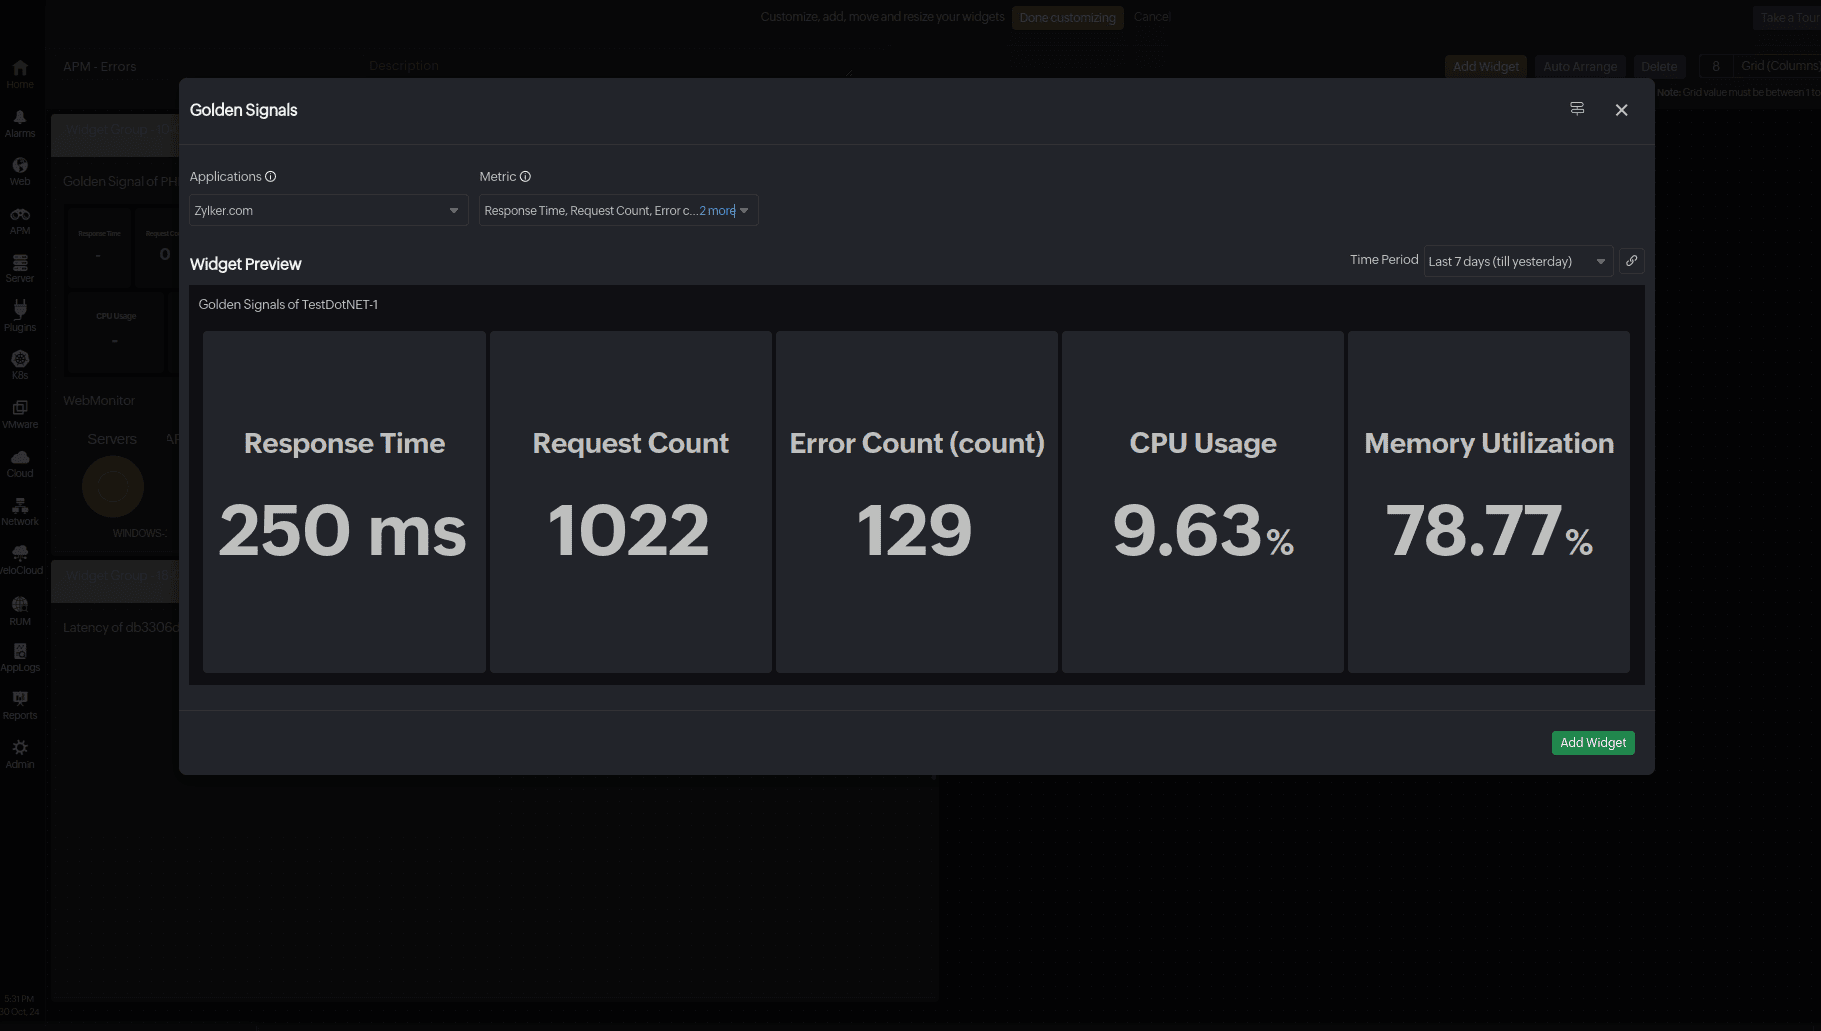
- Golden signals are essential metrics that enable site reliability engineers (SREs) to monitor system health, performance, and reliability. By tracking latency, traffic, errors, and saturation, SREs can gain critical insights, swiftly detect anomalies, and proactively resolve issues before they impact users.
- Latency (Time it takes to serve requests): Commonly measured in milliseconds, this metric helps in analyzing bottleneck situations by monitoring attributes like Response Time and Disk I/O.
- Traffic (Demand on the system): Represents volumes of incoming or outgoing transactions and can be tracked using parameters like Request Count, Throughput, and Network Bandwidth.
- Errors (Failures or issues in the system): Gives the number of application-specific failures like Error Count and Error Rate.
- Saturation (Resource utilization and capacity): Reflects resource consumption and system load in percentages by assessing attributes like CPU Utilization and Memory Utilization.
Enhance monitoring with updated features of Custom Dashboard
- An Availability widget that shows the status of a monitor can be linked to another second-level dashboard that features the status of a specific monitor.
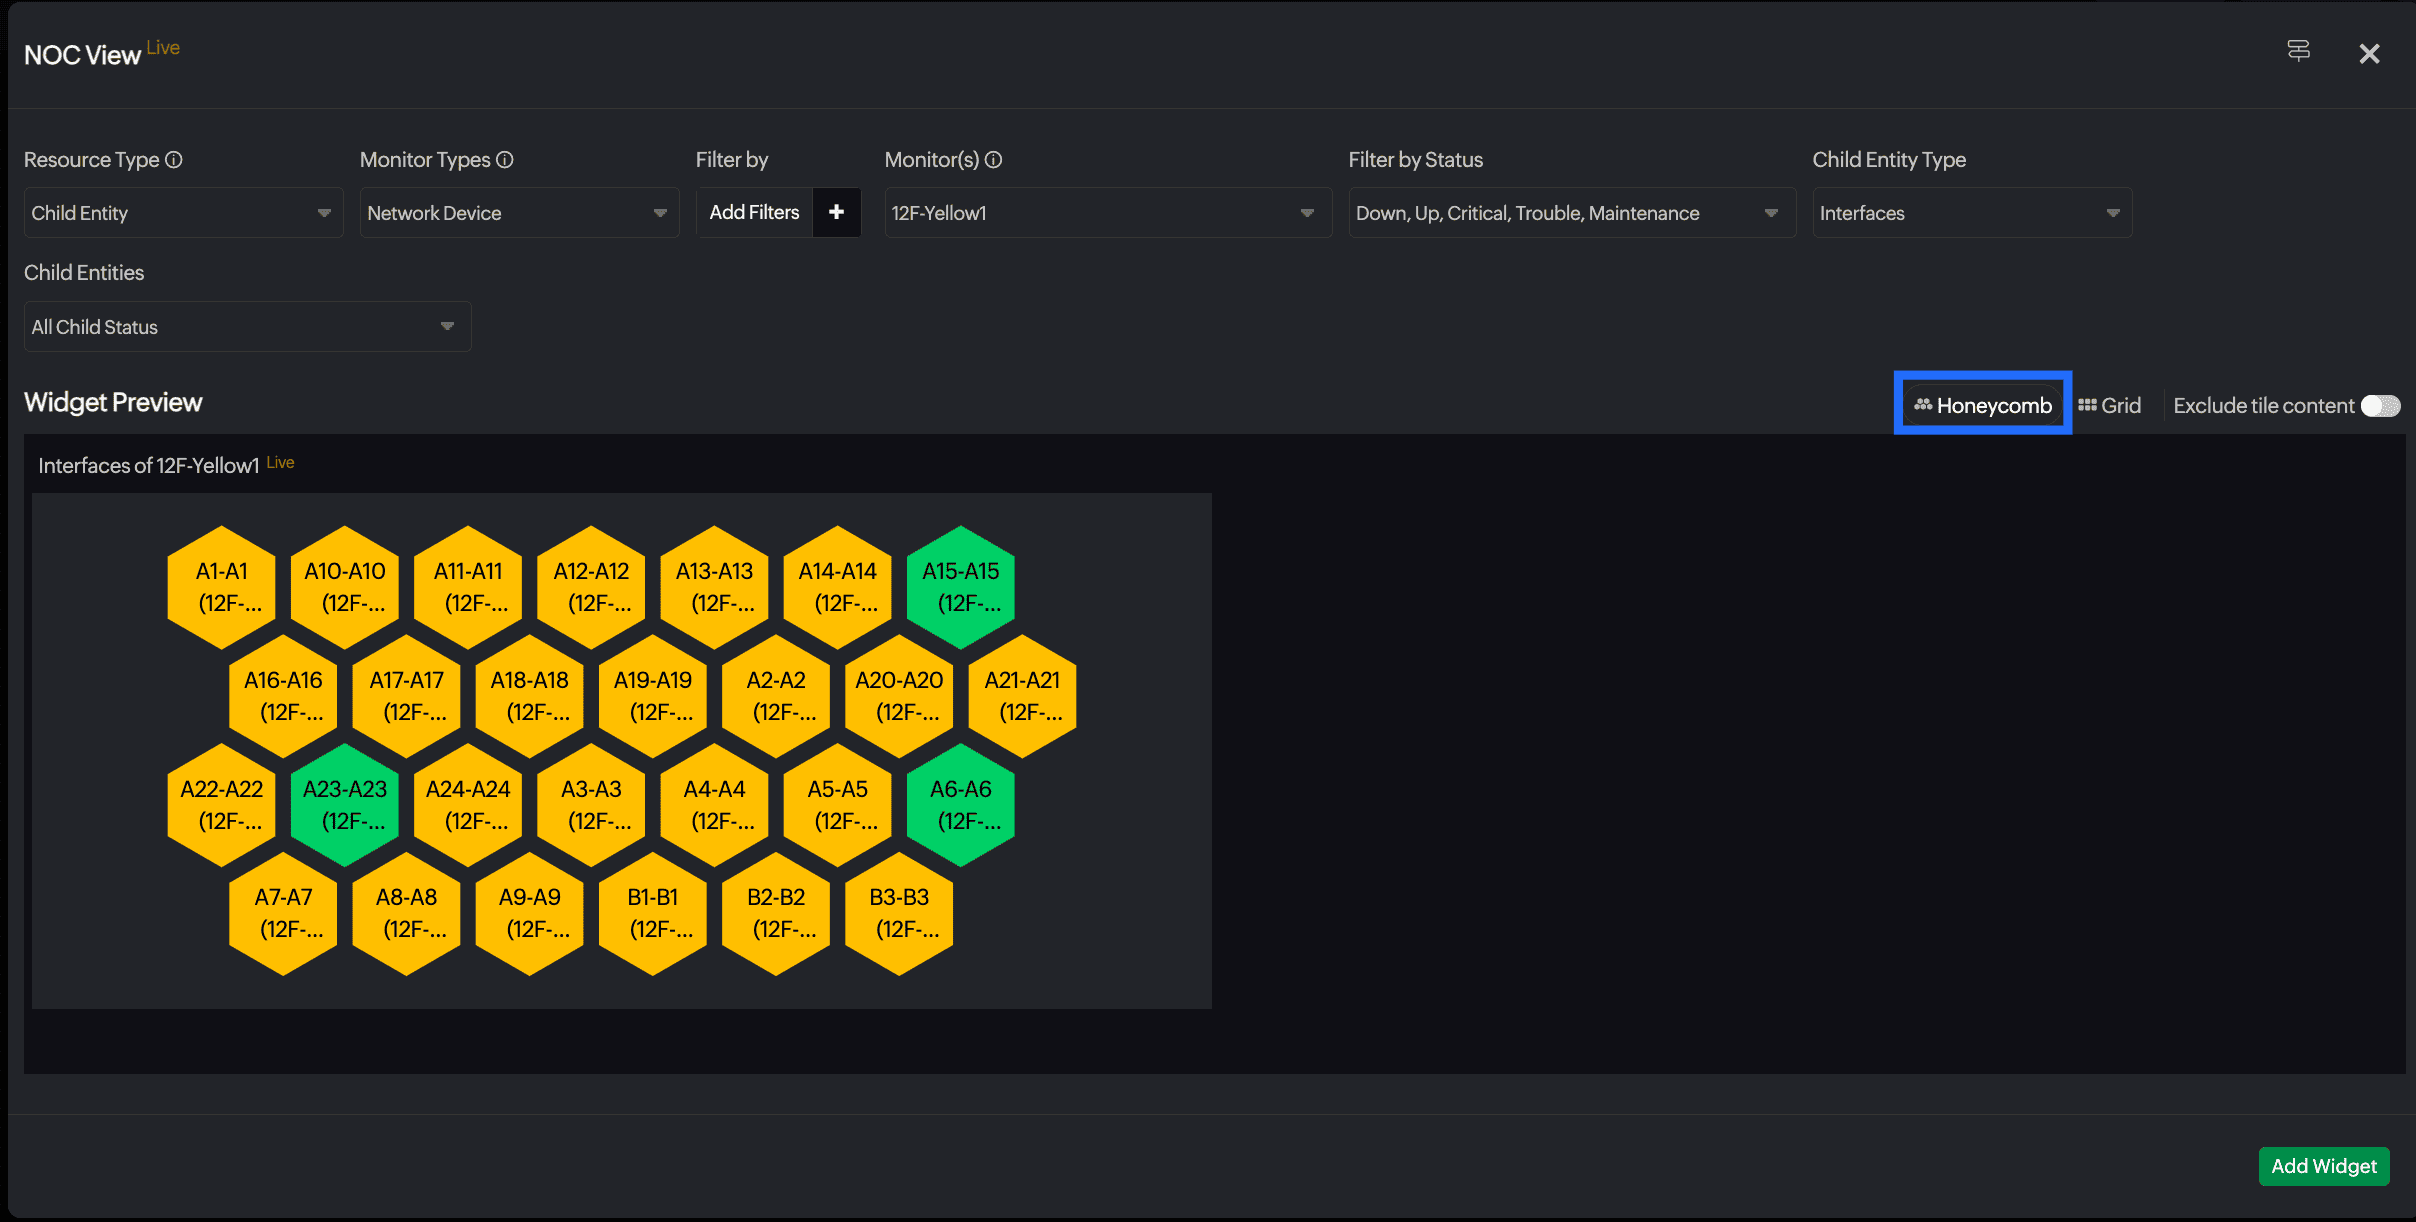
- The NOC View can be linked to the main dashboard for an overview of all monitors.
- When a response time widget shows a critical status, the widget can be linked to an external page explaining the steps to troubleshoot it.
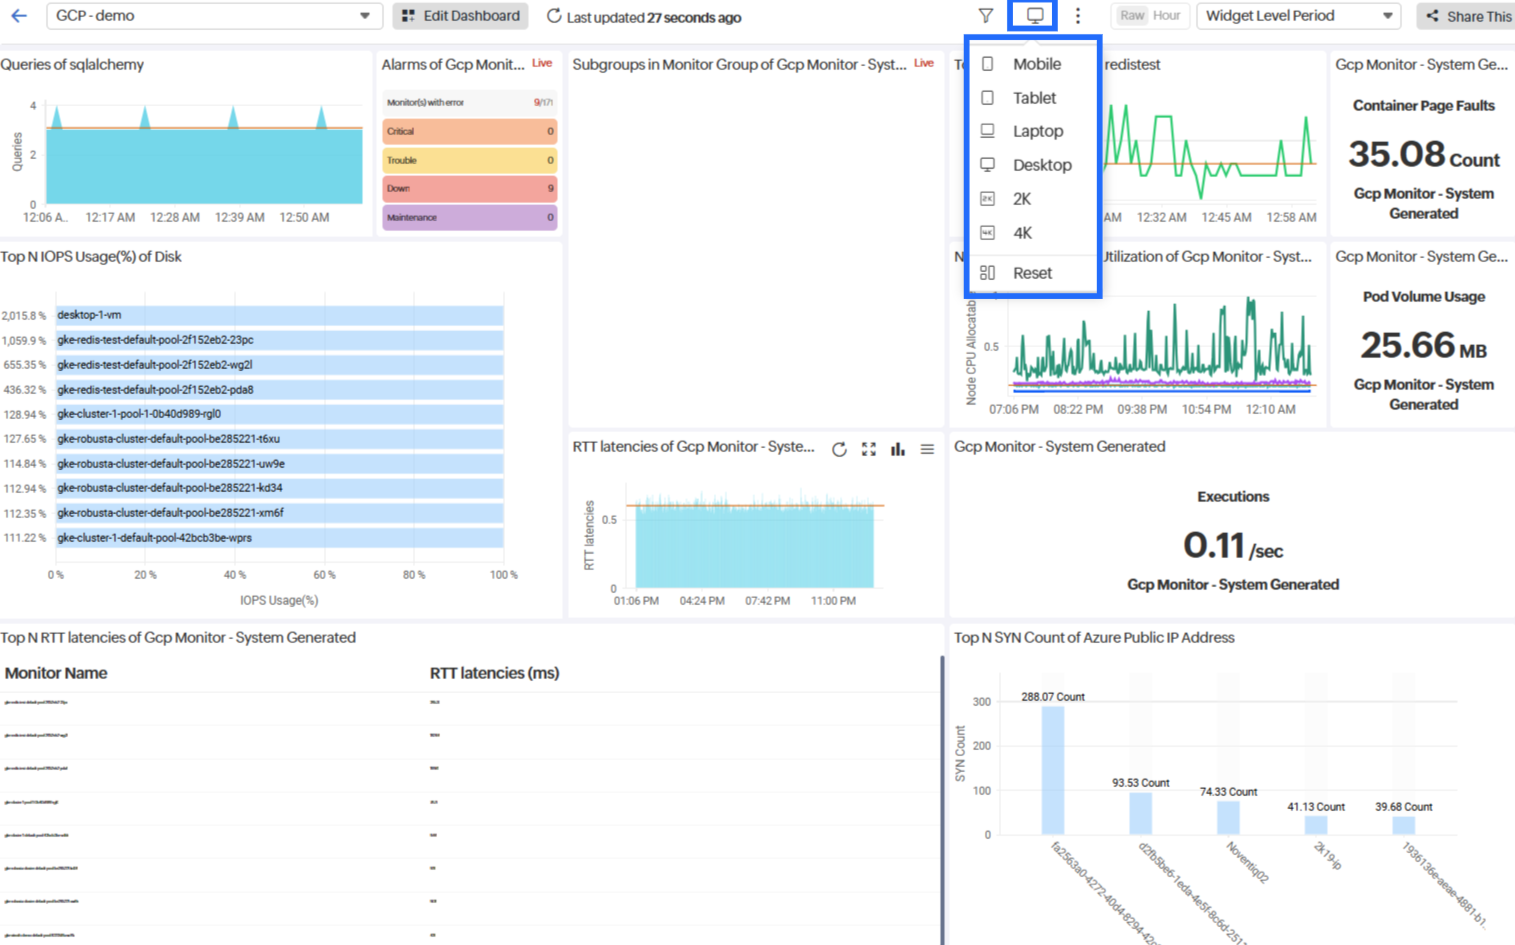
- Fit: Widgets resize automatically to fit within fixed boundaries.
- Vertical Scroll: Boundary extends vertically, adding a scroll bar for navigation.
- Horizontal Scroll: Boundary extends horizontally, adding a scroll bar for navigation.

Topic Participants
Janani Sekar