Leverage log analytics dashboards for better monitoring

Visuals often communicate better than words, and this is also true for monitoring systems. Dashboards are an essential feature in log monitoring systems, providing great value to those who need to analyze and monitor logs. They help centralize log data in a simple, easy-to-read format, avoid clutter, and allow the team to focus on critical metrics. Dashboards combine logs, metrics, and traces into a single view, improving observability, streamlining troubleshooting, and enabling efficient monitoring from one console. This empowers teams to detect anomalies, observe trends, and make proactive, data-driven decisions.
Custom dashboards for observability
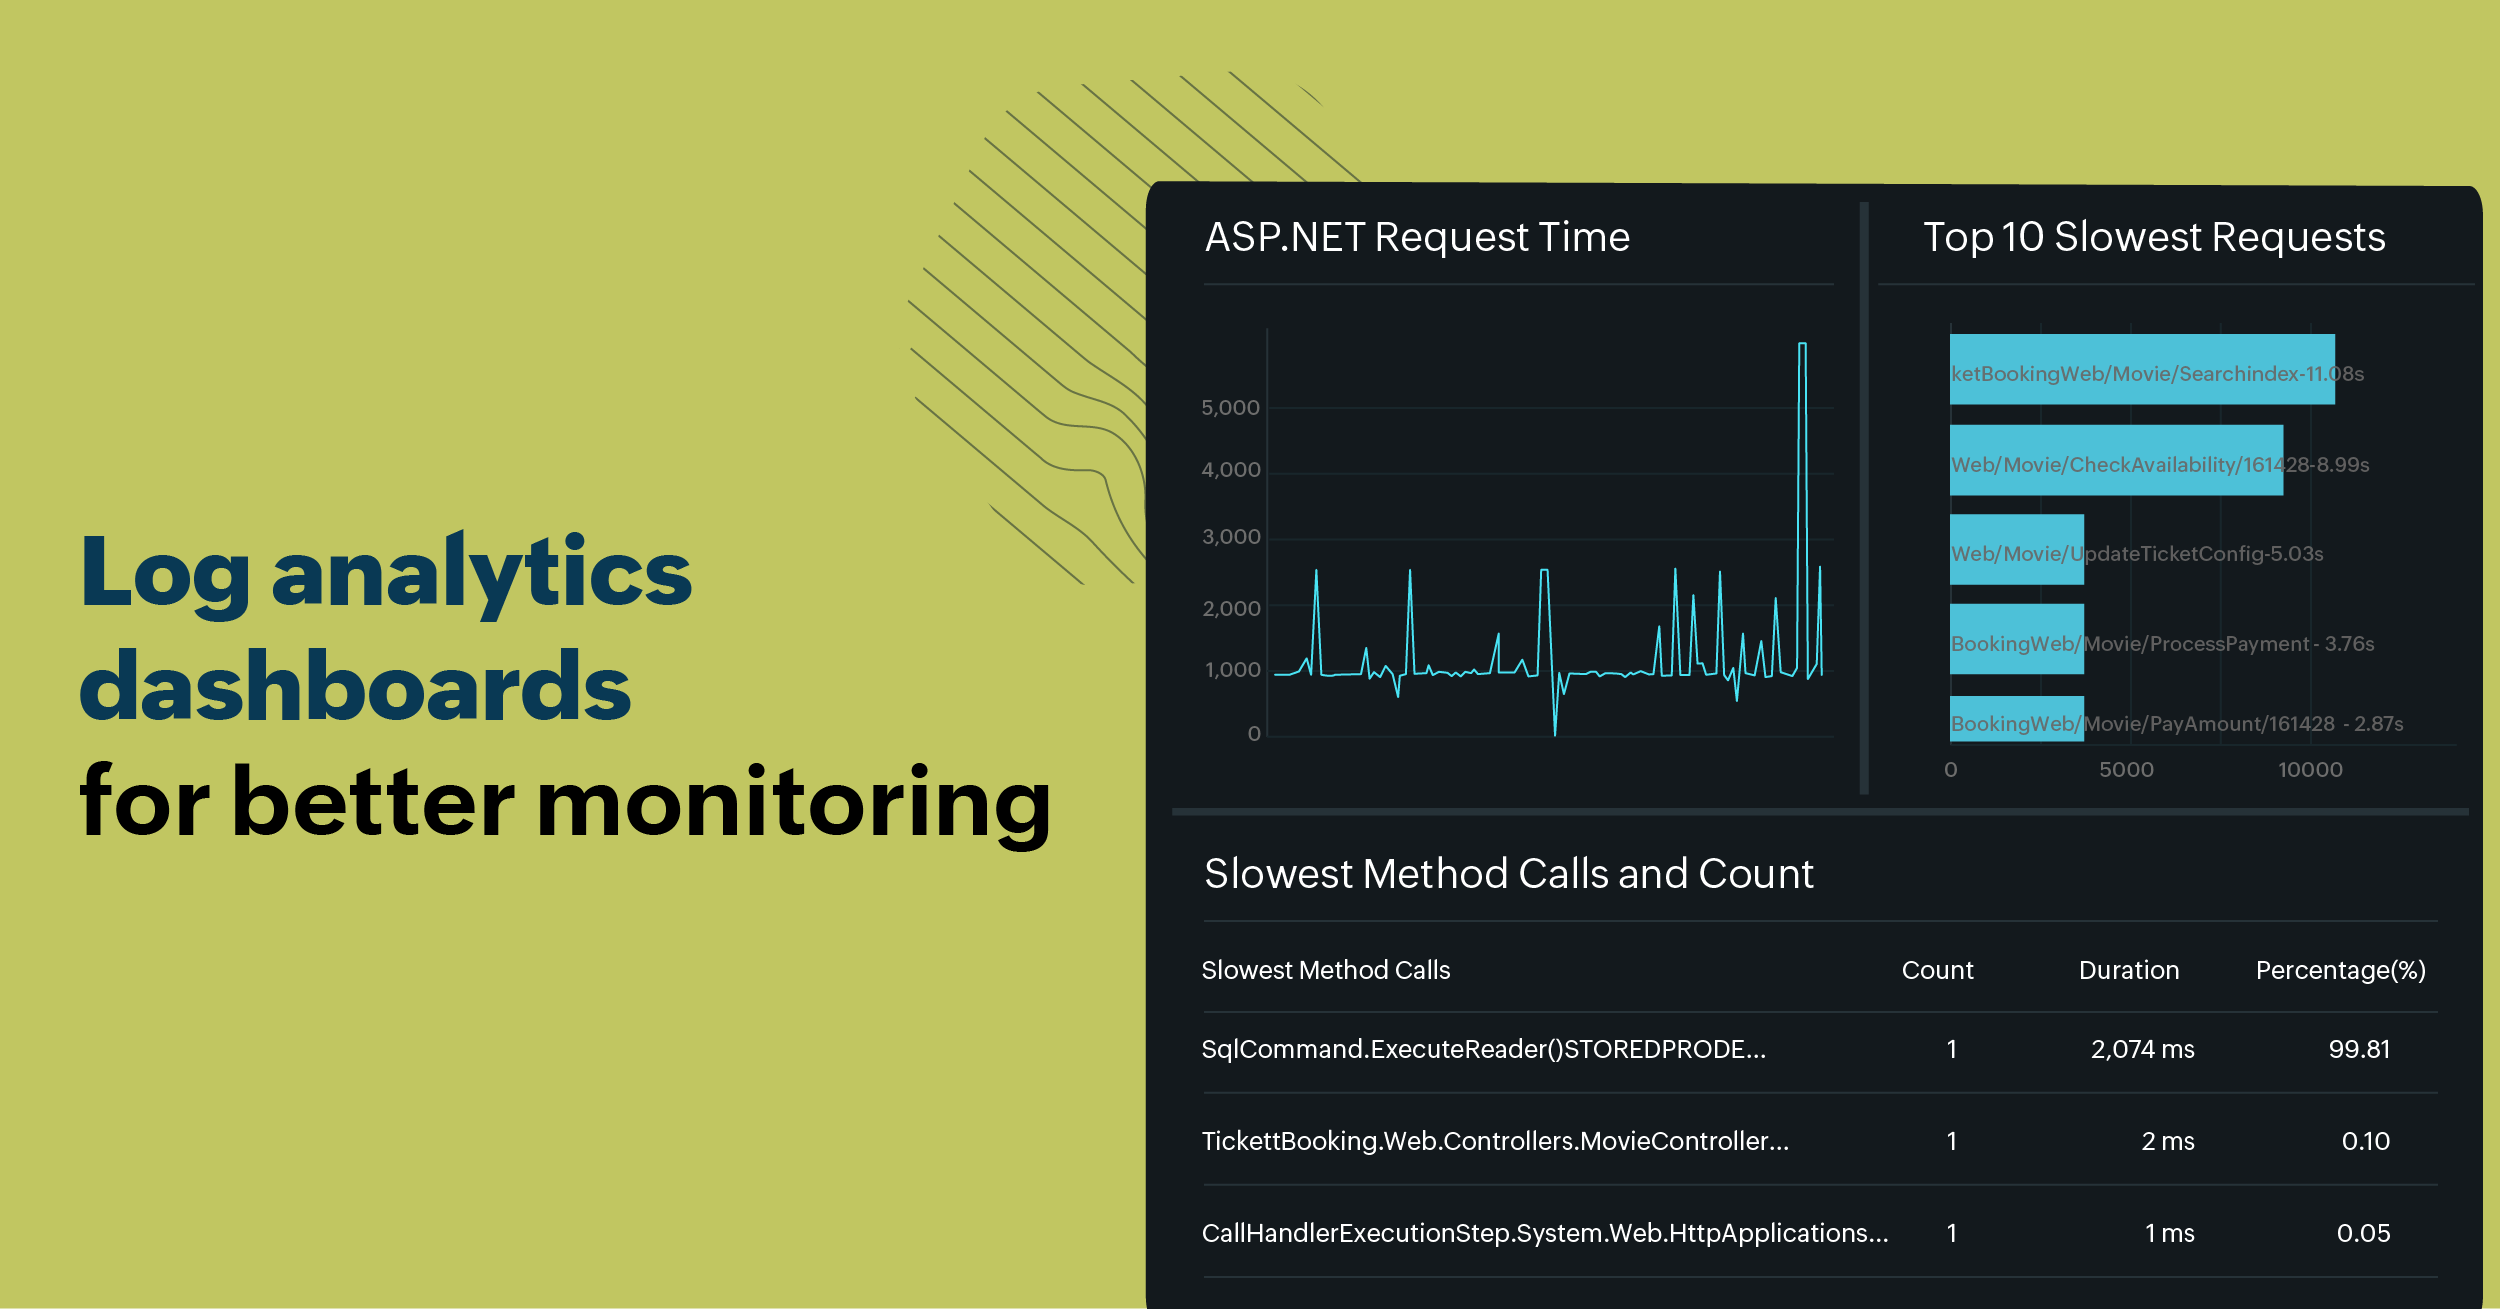
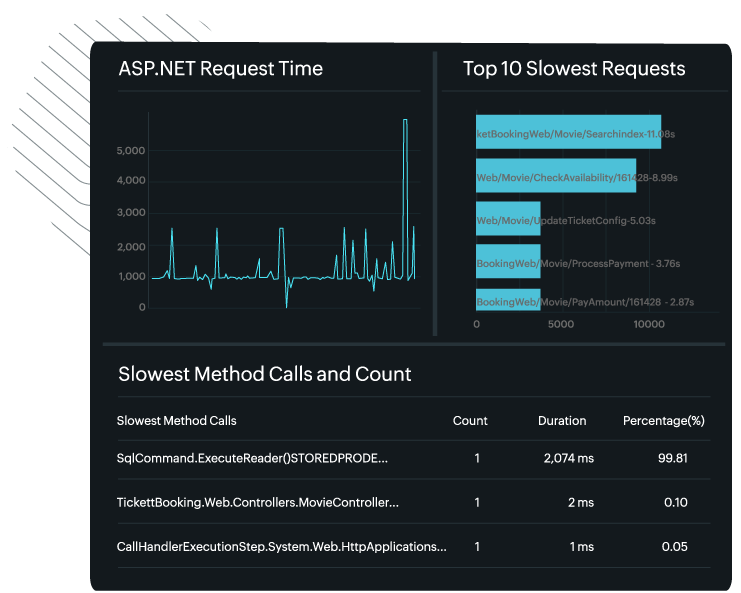
Custom dashboards are essential tools for achieving comprehensive observability, combining critical metrics, logs, and traces into a unified view. For instance, while monitoring a Microsoft Internet Information Services (IIS) web server, metrics such as ASP.NET request time offer a broad perspective on server responsiveness, aiding in the identification of performance bottlenecks. Logs, like the Top 10 slowest requests, provide detailed insights into the specific requests causing delays, helping to trace recurring problems. Traces further enhance visibility by mapping the journey of each request and highlighting the slowest method calls that might be impacting performance.
This interconnected approach allows teams to seamlessly analyze server behavior, identify issues, and implement optimizations. Whether applied to IIS or other systems, custom dashboards empower teams to proactively monitor and improve operational efficiency with a clear and consolidated overview.

Site24x7 provides a powerful log management platform for collecting, analyzing, and monitoring logs from various sources. Among its many features, the dashboards stand out as a vital tool for visualizing log data that aligns with the team's monitoring and business needs.
Key features and benefits of the dashboard
ManageEngine Site24x7 log management dashboards are customizable visual displays that aggregate and present log data in an intuitive and actionable format.
With dashboards, you can:
- Create and configure widgets that display log information in various forms, such as graphs, charts, KPIs, tables, and more.
- Use complex queries to filter logs based on various criteria, such as critical events, status codes, response times, exceptions, and more, and add the results to a custom dashboard.
- Access a default dashboard automatically created for every log type, featuring essential widgets to help you get started quickly.
- Add saved searches to the default dashboard for each log type, or include these widgets in your custom dashboard to compare with application performance metrics.
- Share the dashboard with your team, facilitating collaboration and ensuring that everyone has access to the same insights.
Insights from Windows event logs dashboard
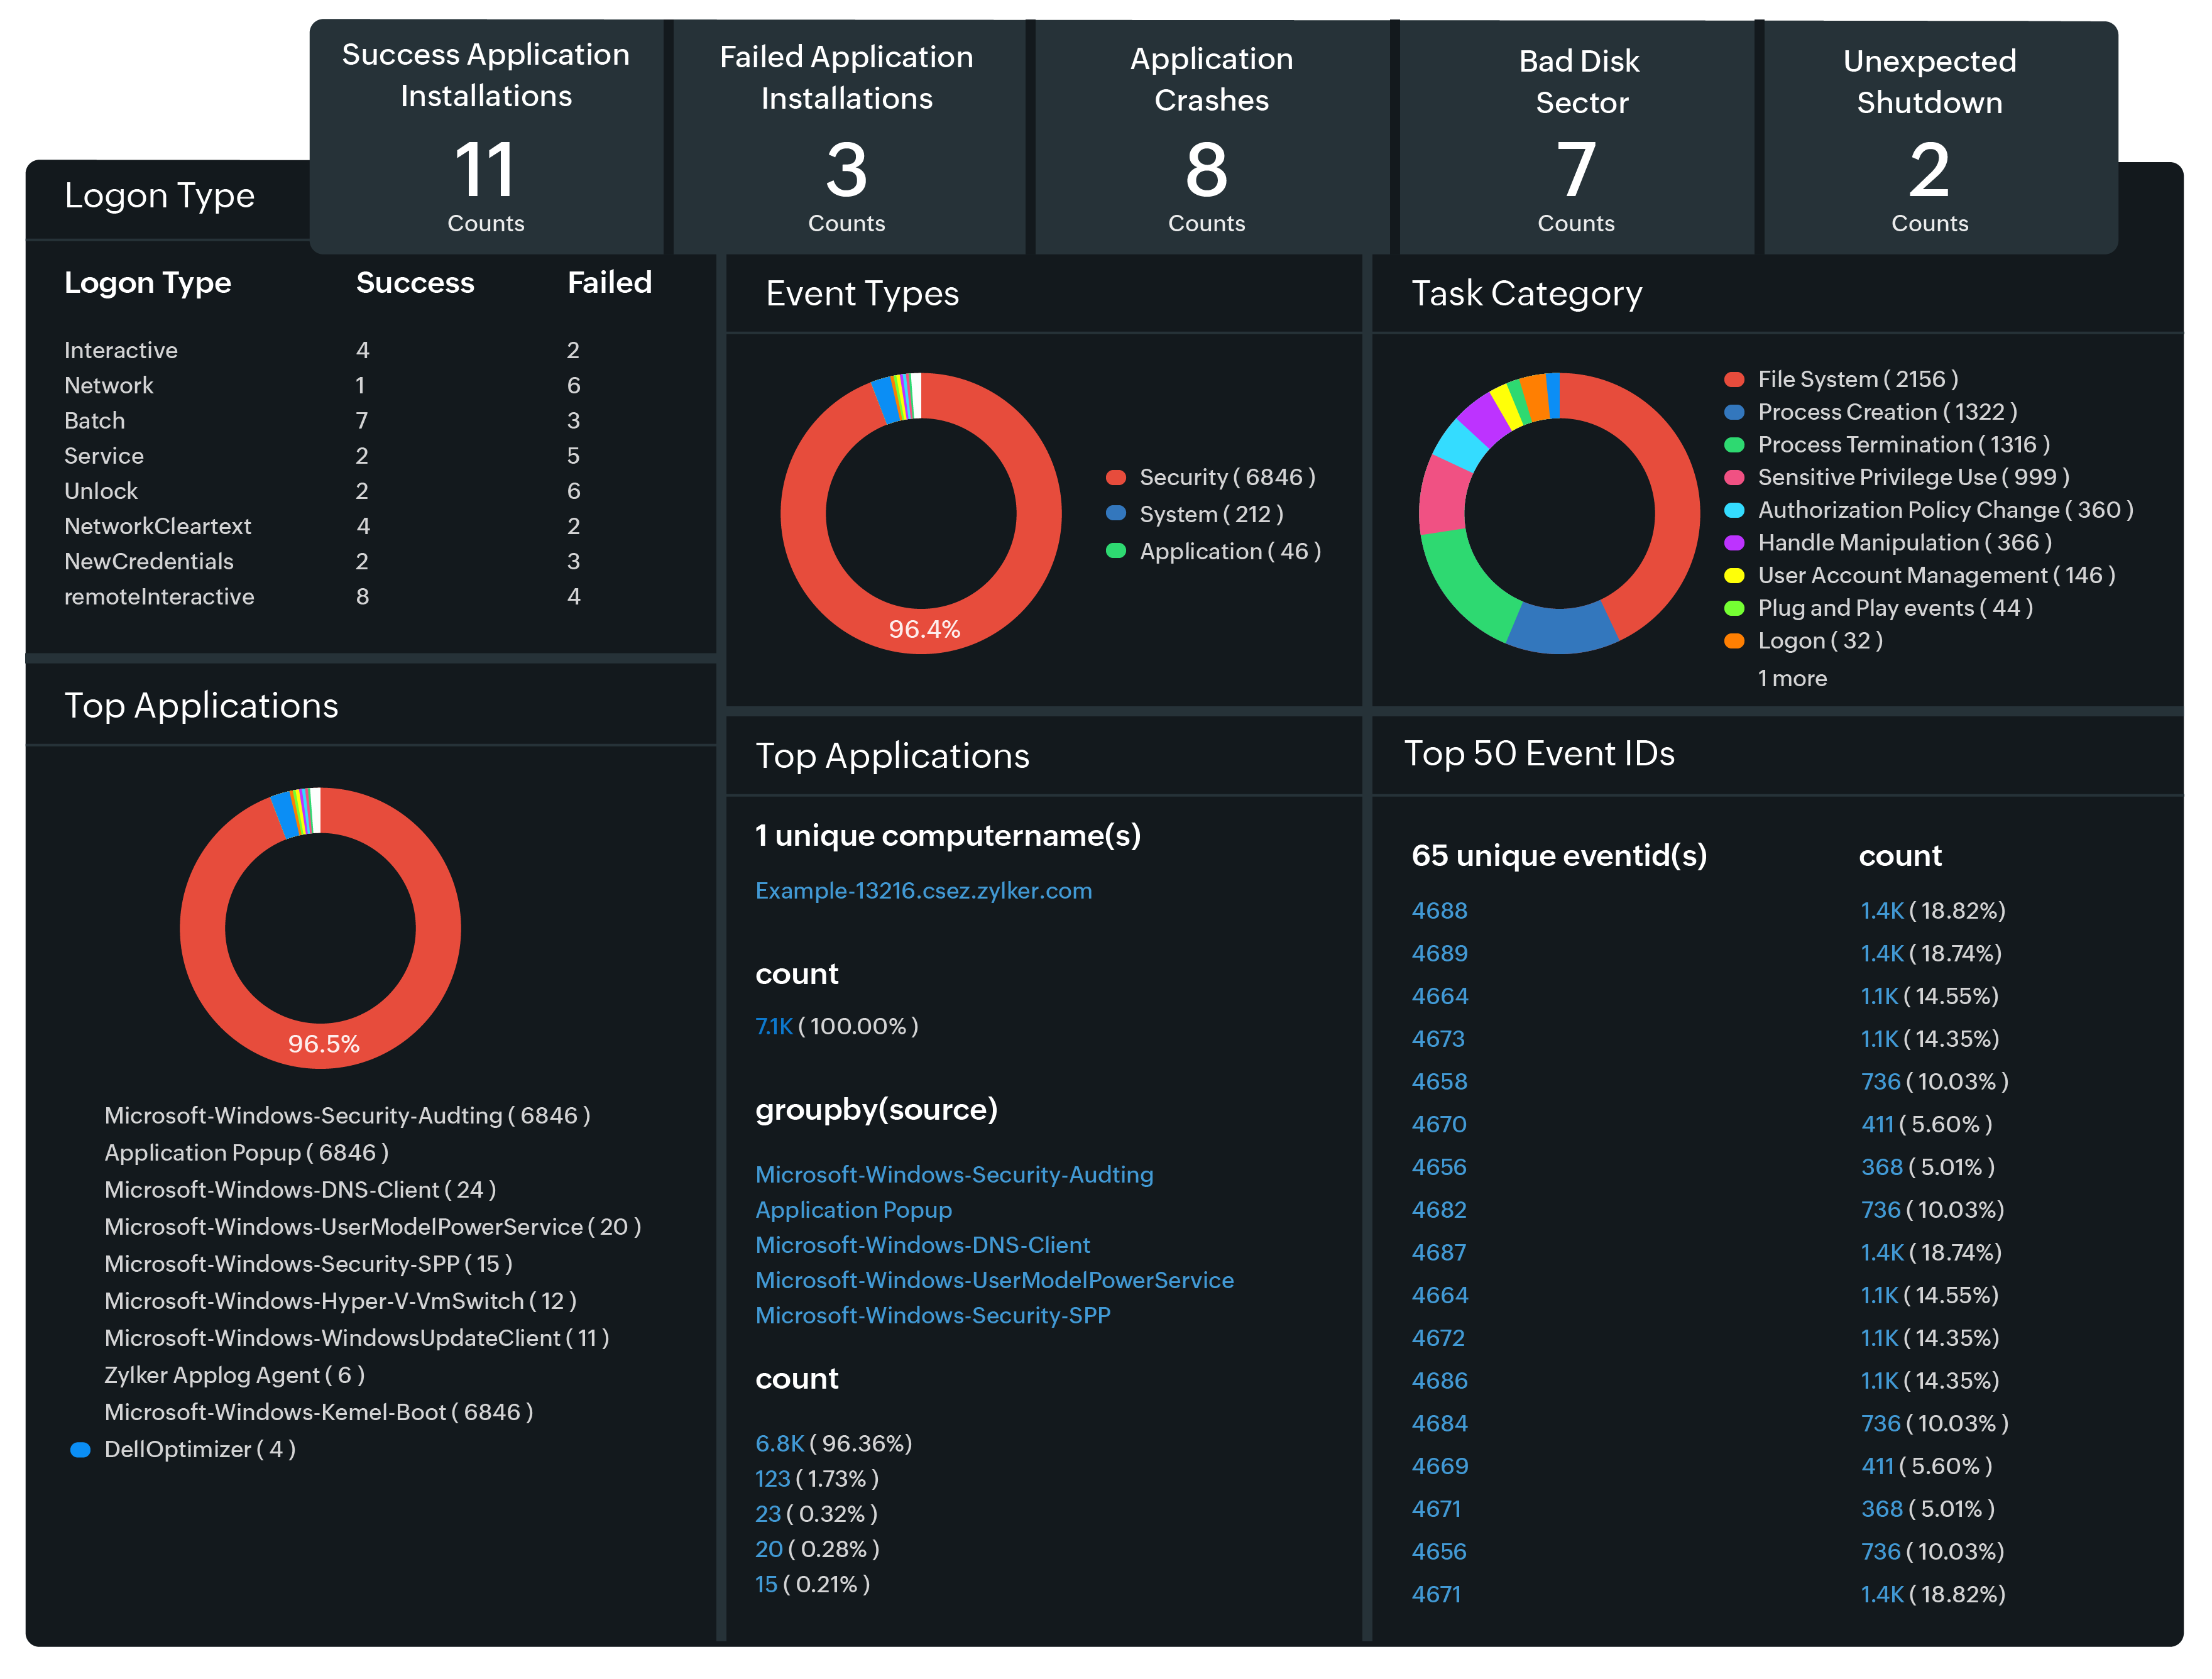
Site24x7's default dashboard provides key insights for log types. Let’s explore how the Windows event log dashboard feature helps DevOps teams troubleshoot issues, optimize systems, and maintain seamless operations.

Metrics such as Application Crashes, Unexpected Shutdowns, Logon Stats, and Top Event IDs focus on core operational insights, making them ideal for monitoring application stability, security, and usage trends.
Key metric: Application crashes
logtype="Windows Event Logs" and (source="Application Error" and eventid="1000") or (source="Application Hang" and eventid="1002")
DevOps teams analyze crash reports to identify causes of application failure, such as incompatible updates or resource constraints, and implement fixes to prevent future occurrences.
Key metric: Unexpected shutdown
logtype="Windows Event Logs" and eventid="6008"
This metric helps DevOps teams track and investigate the causes of unexpected shutdowns, such as hardware failures, software issues, or power outages, to improve system stability.
Key metric: Logon stats
logtype="Windows Event Logs" and (eventid=4624 or eventid=4625)
DevOps can use logon stats to monitor for unusual login activity, such as multiple failed login attempts or logins from unexpected locations, which could indicate security breaches.
Key metric: Top event IDs
logtype="Windows Event Logs" groupby eventid limit 50
DevOps can focus on optimizing the performance and reliability of the most heavily used applications, addressing any issues that could impact a large number of users.
Site24x7’s log management dashboards deliver essential tools to ensure you maintain operational efficiency, security, and reliability in any infrastructure. This solution provides effective log analysis that helps DevOps teams quickly find and fix issues across different environments.
Site24x7's log management dashboards provide a powerful and flexible way to visualize and analyze your log data. By leveraging real-time monitoring, customizable widgets, advanced querying, and collaborative insights, you can gain a deeper understanding of your IT environment and make more informed decisions. Unlock the full potential of your log data with us!
Topic Participants
Subashree K