Kubernetes audit logs
We are glad to announce that Site24x7 AppLogs now allows you to monitor Kubernetes audit logs and gain more insight into your Kubernetes cluster environment.
Enabling and monitoring Kubernetes audit logs helps you:
- Get detailed information about who did what, when, and where.
- Troubleshoot permission- and privilege-related role-based access control (RBAC) policy issues.
- Debug issues in your cluster.
The audit policy and the backend are the two basic configurations you must set in the API server to output the audit logs. Audit events are processed based on the policy rules, and the backend pushes audit events to any of the following storage:
- Log backend
- Webhook backend
Kubernetes audit logs support both on-premises and cloud environments (Azure Kubernetes Service and Amazon Elastic Kubernetes Service). Kubernetes audit logs are supported in GCP too. But as of now, we don't have support to collect logs from GCP.
Follow the steps in this document to configure Kubernetes audit logs in Site24x7 AppLogs.
Here's an image of the Kubernetes audit log dashboard:
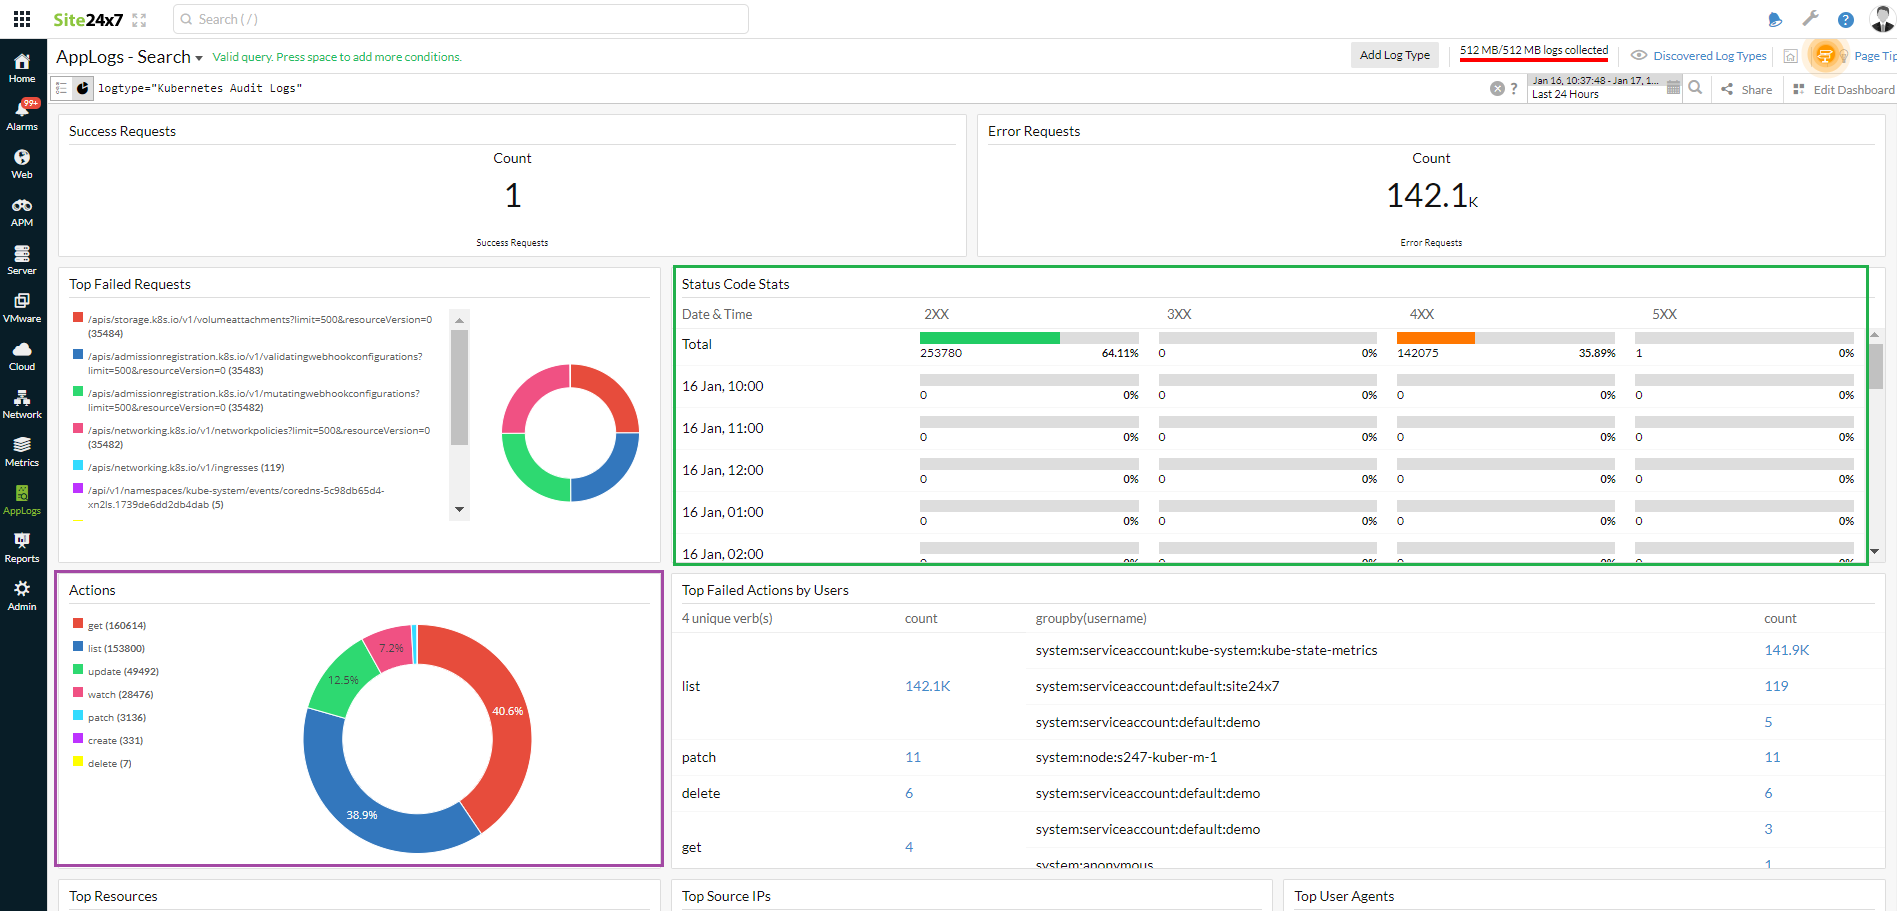
Find below a few use cases to decode the dashboard:
Use case 1: Who did what, when, and where
Create, update, delete, and patch are important cluster-changing operations. The Actions widget on the dashboard lists the set of actions performed in the cluster. You can dive into each of these operations' details and gain more information.
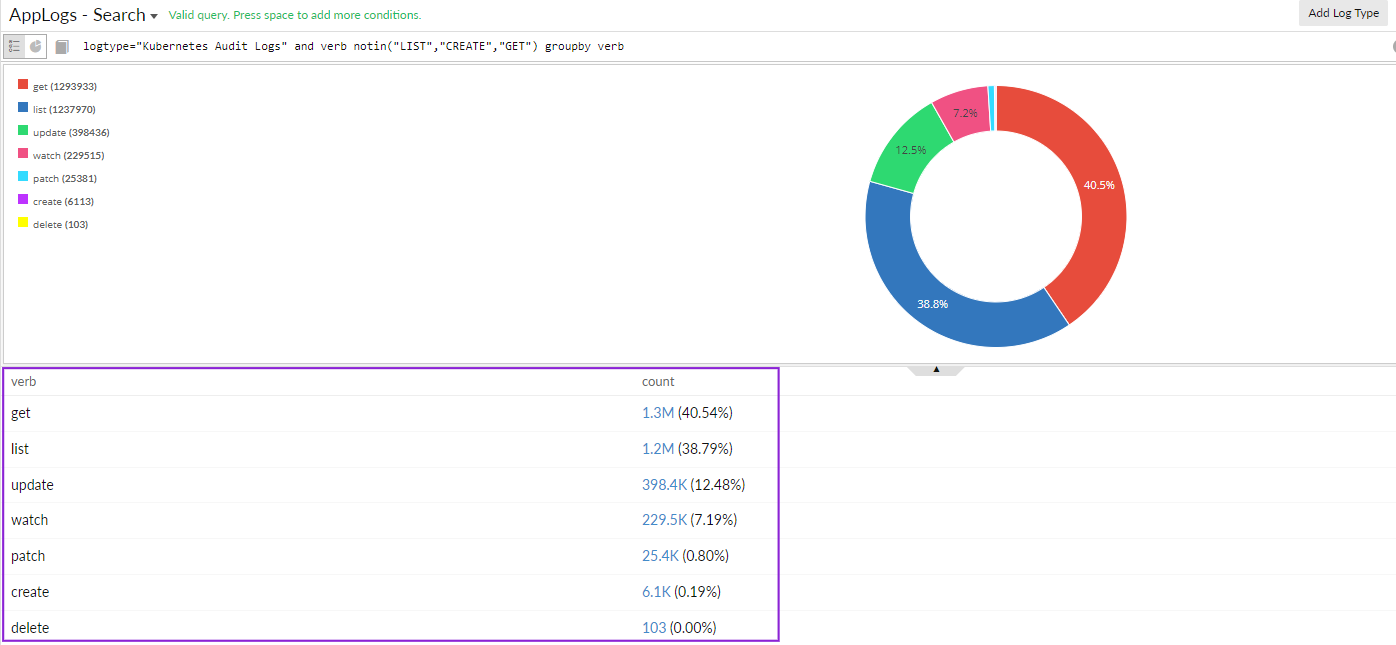
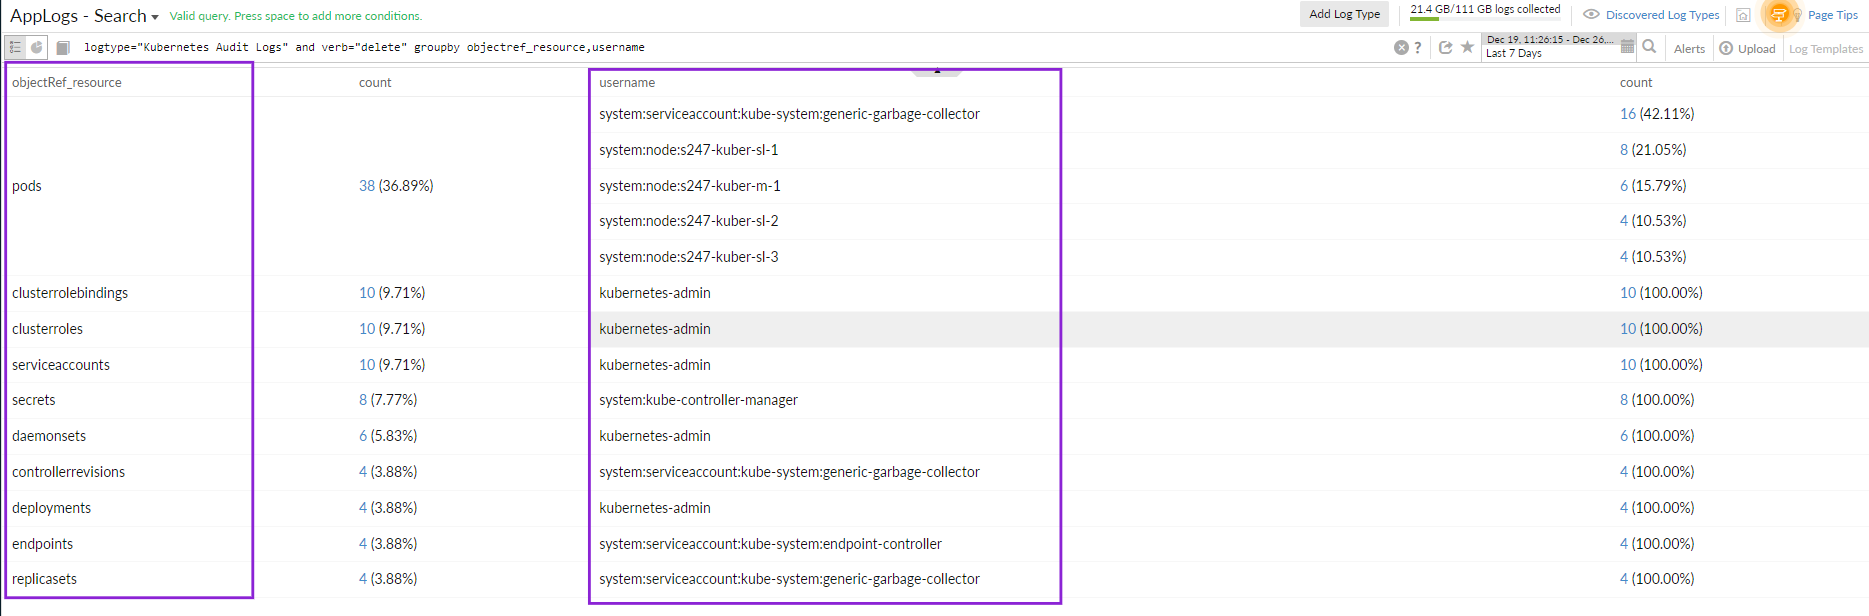
For example, if you want to know who deleted a resource in the cluster, you can use the below query to drill down to the information:
logtype="Kubernetes Audit Logs" and verb="delete" groupby objectref_resource,username
Use case 2: Troubleshoot permission- and privilege-related RBAC policy issues
When you look at the Status Code Stats widget on the dashboard, there are status codes above 400. To learn more, click the error code, which will direct you to the events that led to this issue. You can use the query language filter below to determine the root cause.
logtype="Kubernetes Audit Logs" and responsestatus_code=403 and verb="list" groupby username
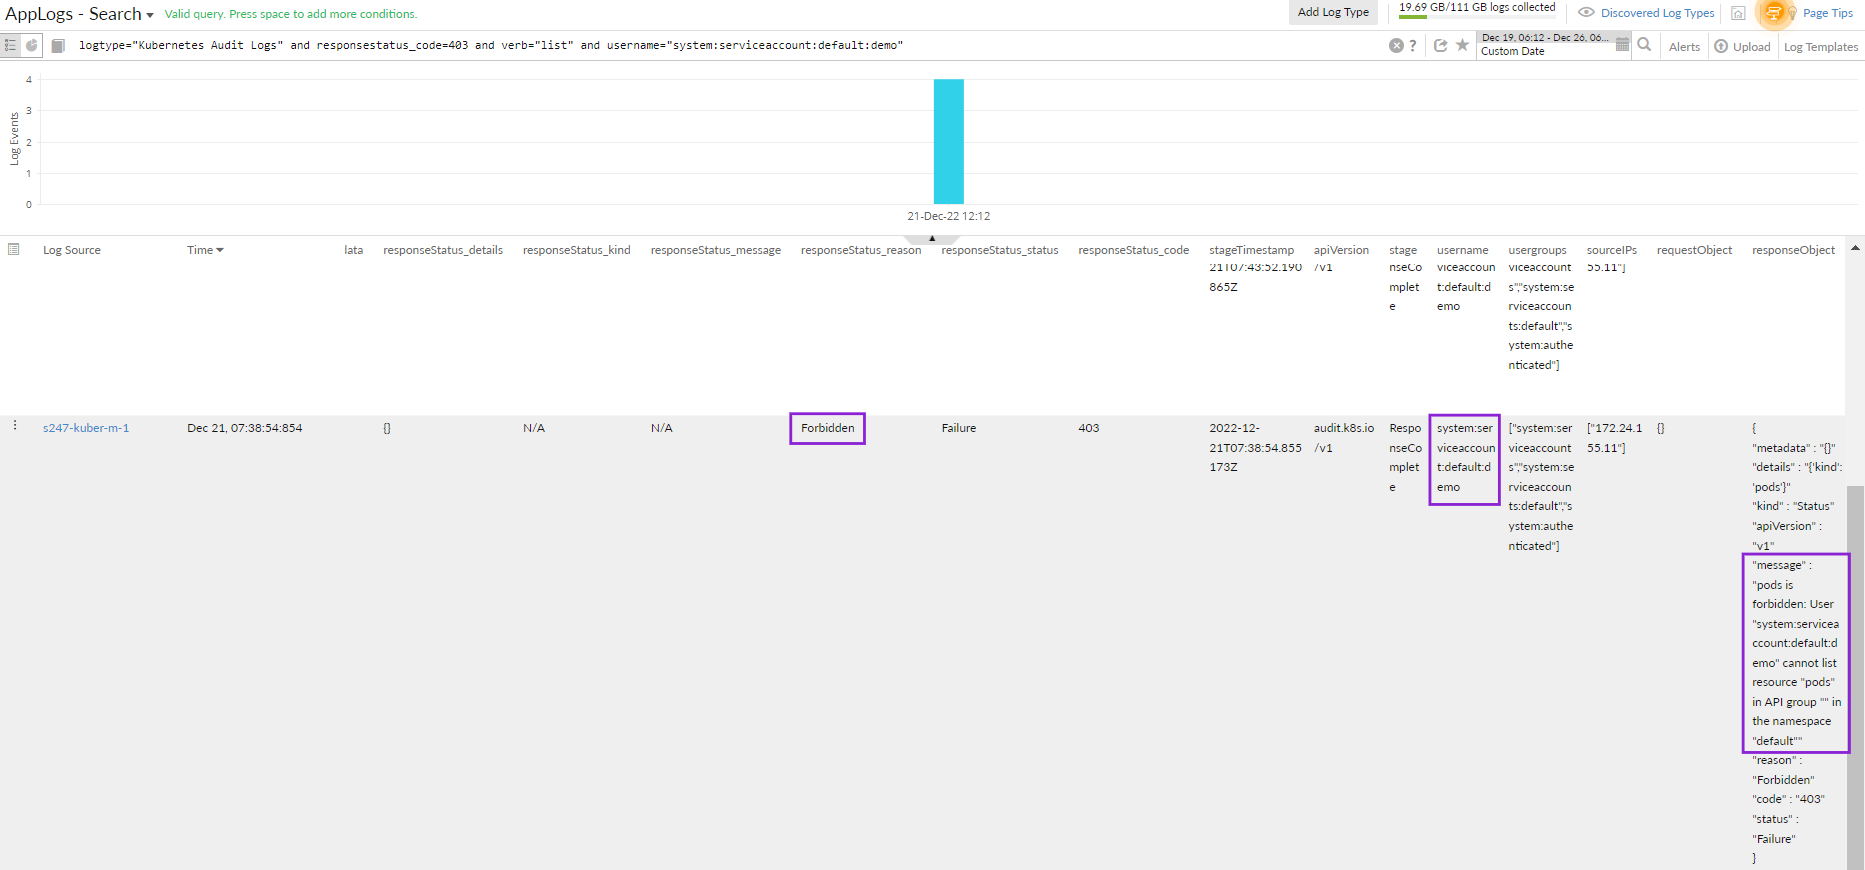
The above query will display the list of users who performed the list action. You can click any username to find the reason for the 403 error.
logtype="Kubernetes Audit Logs" and responsestatus_code=403 and verb="list" and username="system:serviceaccount:default:demo"
The results below show that the demo user did not have access to the pod, resulting in the error. You can take remediation actions accordingly.
To keep track of everything happening in your cluster, you need to monitor your Kubernetes audit logs with Site24x7 AppLogs. Feel free to drop your feedback, suggestions, and feature requests as comments below.
Until next time,
Happy logging!
Topic Participants
Subashree K