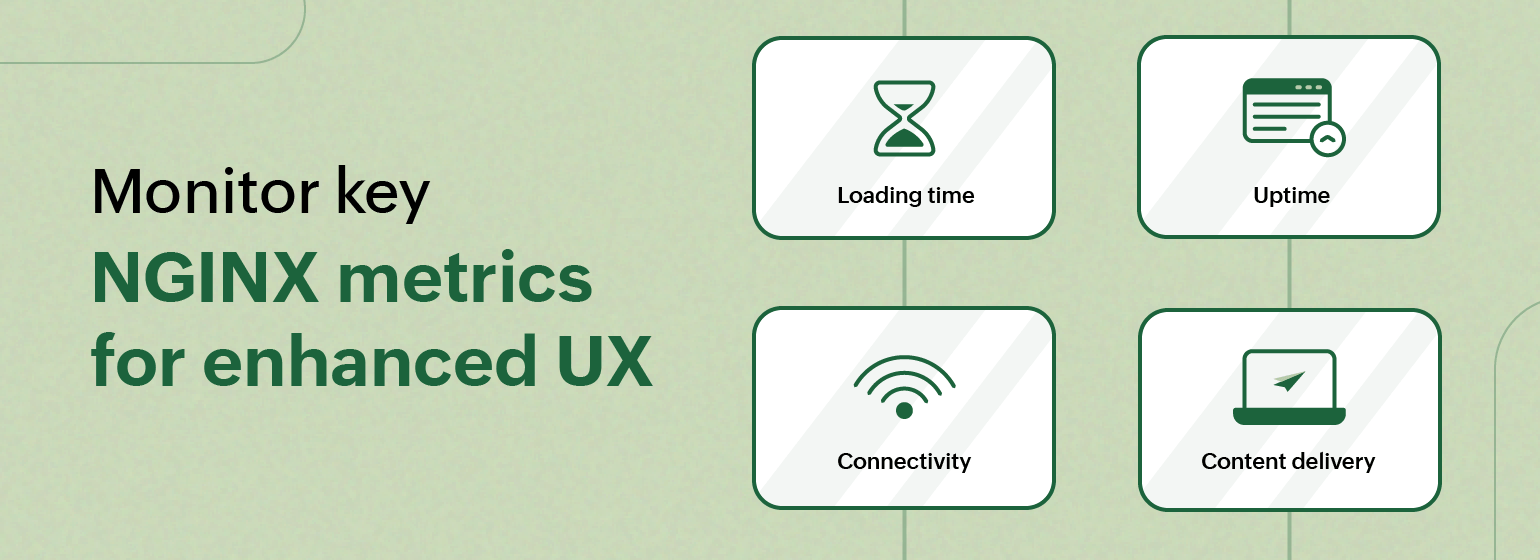
How to mitigate common user experience issues by effectively monitoring key NGINX metrics

Delivering optimum user experience is critical for any organization. The performance of web servers plays a pivotal role in determining the quality of your online platforms. And the smooth delivery of content and seamless interactions in websites and web-based applications are crucial for gaining engagement and retaining users. However, achieving this level of performance requires more than just a well-designed interface—it takes an understanding of server behavior alongside proactive monitoring to address potential issues.
NGINX is a widely-used web server that plays a vital role in web application ecosystems. By keeping a close eye on key NGINX metrics, administrators can gain valuable insights into server health, diagnose performance bottlenecks, and fine-tune configurations to ensure a smooth and uninterrupted user experience.
Let's take a look at common issues that can affect user experience and explore how monitoring NGINX metrics can help you identify and mitigate performance issues.
1. Slow loading times
Users today expect instant access to content. Slow loading times can frustrate users, leading to increased bounce rates and decreased engagement. Improving loading speed can enhance user satisfaction and retention, as well as boost conversion rates.
Key NGINX metrics to track:
- Currently Active Client Connections
- Number of Connections where NGINX is Reading the Request Header
- Number of Connections where NGINX is Writing the Response Back to the Client
- Response Time
Causes: Slow loading times often arise from high server load, causing the queuing of requests. Elevated active client connections as well as reading and writing connections in NGINX indicate a heavy load. Response time increases as servers struggle to handle requests, resulting in slow load times.
Solutions:
- Optimize NGINX configuration by adjusting worker processes, connections, and timeouts to match hardware and workload. This improves request handling and reduces response latency.
- Scale server capacity by upgrading hardware components like CPU, memory, and storage, or by deploying additional server instances to distribute the workload.
2. Website or application downtime
Application downtime disrupts user tasks, leading to productivity loss and diminished trust. Continuous uptime ensures a seamless user experience, maintaining user trust, satisfaction, and engagement.
Key NGINX metrics to track:
- Server Uptime
- Dropped Connections
Causes: Website or application downtime can result from network issues or server misconfigurations causing dropped connections, as indicated by relevant NGINX metrics.
Solutions:
- Proactively monitor network performance to promptly detect and resolve connectivity issues. By addressing issues promptly, you can maintain network stability and minimize downtime, ensuring uninterrupted service availability.
- Implement redundancy and failover mechanisms to enhance resilience and availability. This includes setting up redundant servers, load balancers, and clustering technologies to automatically redirect traffic during server failures to minimize disruptions and downtime.
3. Unreliable connectivity
Unreliable connectivity hinders access, leading to disruptions and decreased productivity. Consistent connectivity can boost user retention through improved user satisfaction, productivity, and efficiency.
Key NGINX metrics to track:
- Currently Active Client Connections
- Number of Idle Client Connections Waiting for a Request
- Dropped Connections
Causes: Unreliable connectivity is usually caused by network issues, including dropped connections and idle connections waiting for a request. These issues can disrupt the seamless flow of data between clients and servers, leading to degraded performance and user experience.
Solutions:
- Proactively monitor network health to identify and resolve issues such as packet loss, latency spikes, or network outages, ensuring reliable connectivity and minimizing disruptions.
- Optimize NGINX configuration to improve connection management and responsiveness. Adjust parameters like timeouts and buffer size to enhance resource usage and minimize the impact of idle or dropped connections on system performance.
4. Poor content delivery
Seamless content delivery ensures users get access to complete, relevant information efficiently, enhancing satisfaction and trust. It's crucial for retaining engagement and credibility for online platforms.
Key NGINX metrics to track:
- Cache Hit Ratio
- Client Request Count
- Count of Dropped Connections
Causes: Poor content delivery can result from dropped connections, leading to incomplete or slow-loading web pages. Also, too many client requests strains servers, causing slow responses or dropped connections due to overload and contributing to poor content delivery.
Solutions:
- Optimize content delivery mechanisms, including server configurations, improving network infrastructure, and implementing load balancing techniques to efficiently handle client connections.
- Implement caching strategies to accelerate content delivery and reduce reliance on server-client connections.
- Monitor and address network issues promptly to minimize dropped connections and ensure smooth content delivery.
How can Site24x7 help you deliver optimal user experiences by monitoring NGINX?
Site24x7's NGINX monitoring plugin integration tracks key NGINX metrics that help you to detect issues affecting user experience so you can troubleshoot them effectively or proactively manage them to optimize the performance of your application.
Its robust platform features enable admins to effectively monitor NGINX metrics at all times and stay on top of any potential issues. Below are some ways admins can leverage Site24x7's platform features to resolve NGINX issues.
Threshold-based alerts: Set thresholds for server uptime, response times, or dropped connections and receive instant notifications when performance deviates from expected levels. This ensures timely notification of potential issues, allowing administrators to take proactive measures to mitigate them.
Anomaly detection: Receive alerts for anomalous patterns, such as sudden spikes in active connections or unexpected changes in response times. Anomaly detection helps detect and address performance issues before they impact user experience.
IT automation using scripts: Create scripts to automatically restart NGINX services in case of performance degradation or restart servers in response to downtime incidents. This ensures timely resolution of issues and minimizes manual intervention.
Get started monitoring NGINX with Site24x7
If you're not already using Site24x7, sign up for a free trial today. You can also try our NGINX monitoring plugin integration to monitor your NGINX web servers free for 30 days.
Check out more on our plugin integrations along with the steps to set up alerts, custom dashboards, IT automation, and more.
Topic Participants
Sinjan Ballav