Enterprise applications monitoring for JBoss server
Modern JBoss deployments rely on multiple layers working together: JVMs, thread pools, data sources, deployed applications, transactions, and messaging systems. When issues like memory pressure, thread contention, slow database connections, or failed transactions arise, locating the exact root cause can become challenging without the right level of visibility.
We are pleased to introduce Enterprise Application Monitoring for the JBoss application server. It unifies critical performance data across your server, applications, and supporting components into a single view so you can quickly understand what’s happening, troubleshoot faster, and maintain consistent performance and reliability.
With this feature, you can:
Monitor server and JVM performance
- Track CPU usage, JVM memory utilization, heap size, and response time.
- Monitor live threads, daemon threads, class loading, and garbage collection indicators.
- Analyze transaction activity, including committed, aborted, timed-out, and in-flight transactions.
- Get details on server state, running mode, process type, and JBoss version.
- Track system-level information like available processors and the operating system.
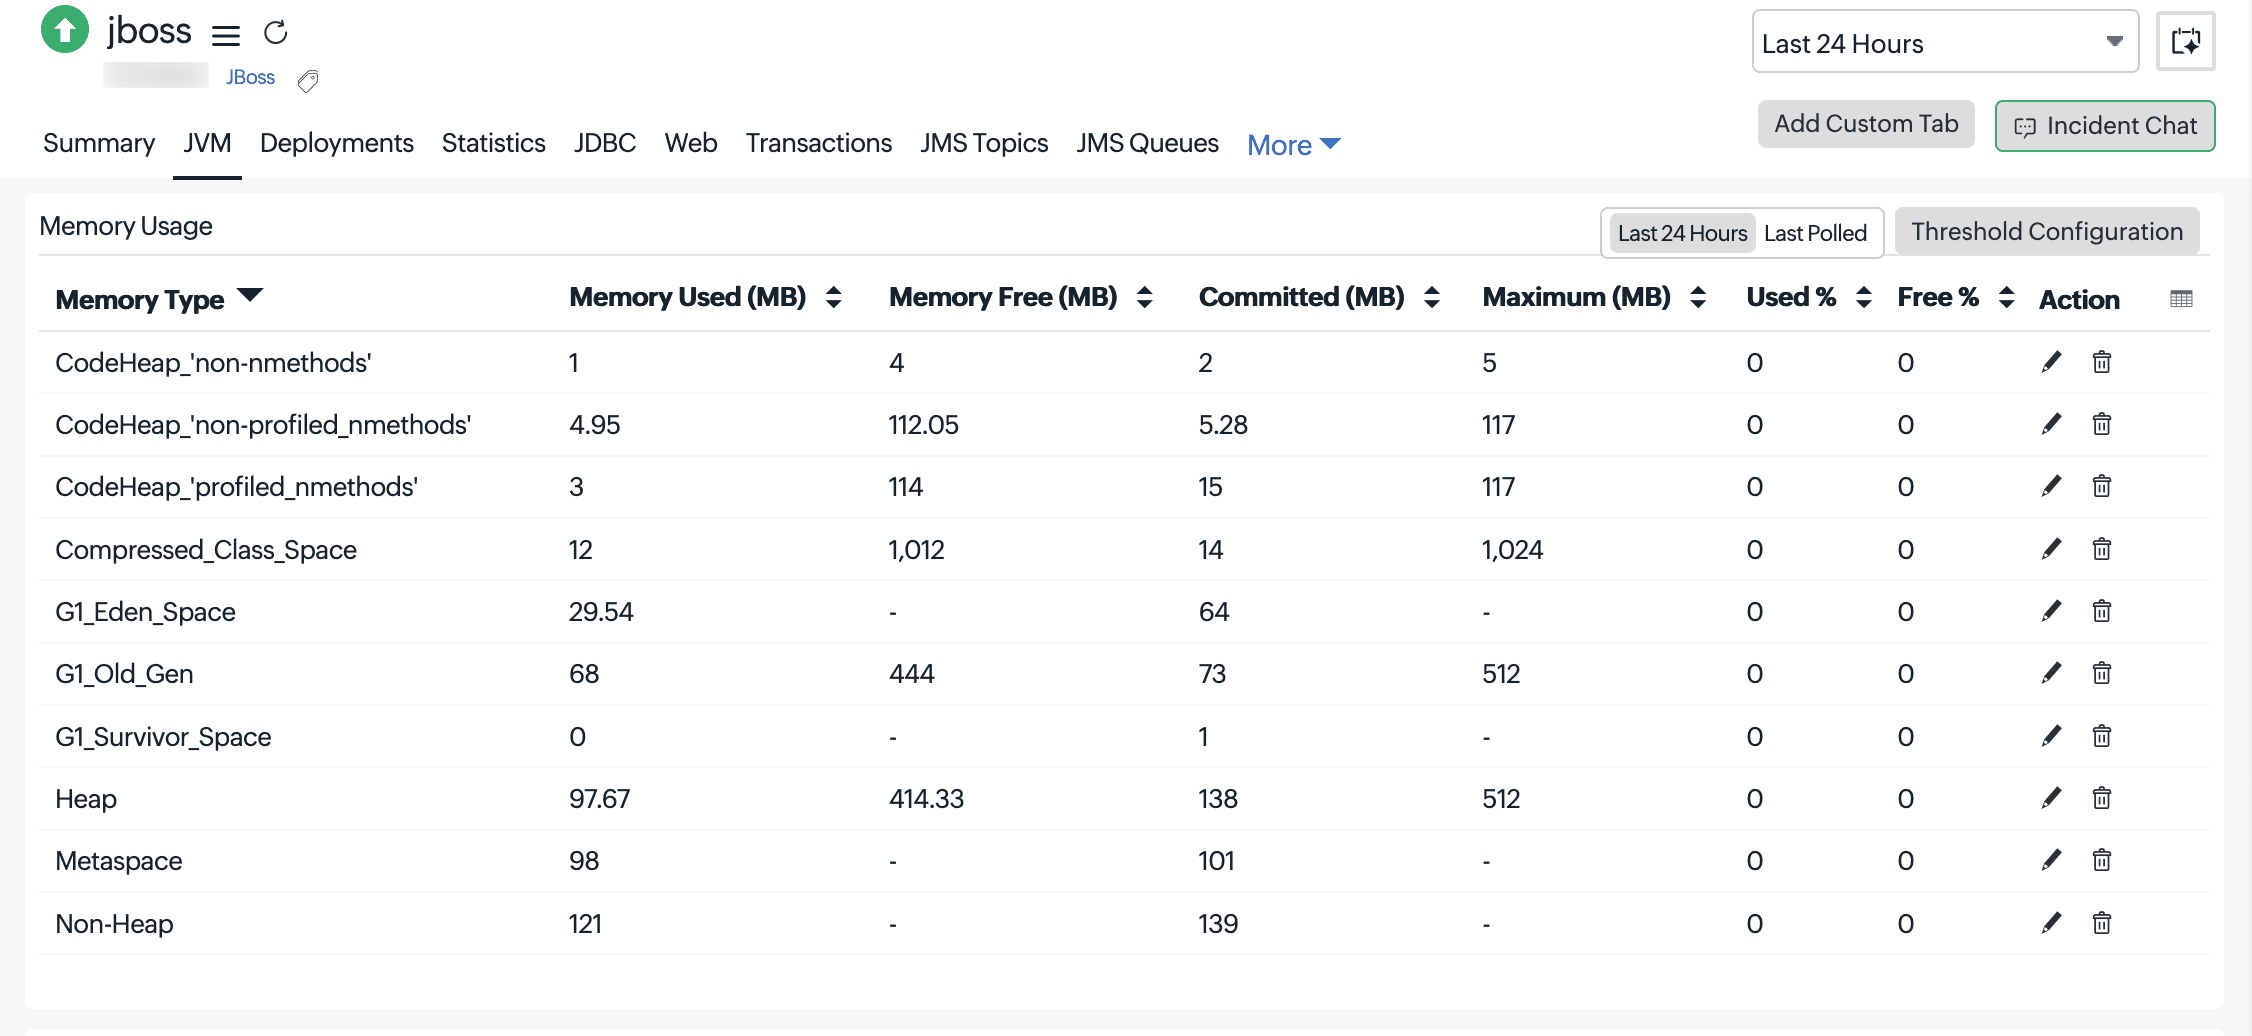
- Monitor heap and non-heap memory pools, including used, free, committed, and maximum memory.
- Identify memory pressure using usage percentage and pool-level metrics.
- Monitor request count, processing time, and throughput across connectors.
- Track error counts, failed requests, and data transfer (bytes sent/received).
- Analyze connection pool usage, active connections, and wait counts.
- Track connection creation/destruction, timeouts, and blocking time.
- Identify saturation and performance bottlenecks in database interactions.
- Track messages in the queue, delivery status, and consumer activity.
- Monitor subscriptions, message throughput, and delivery delays.
- Identify backlogs and messaging bottlenecks.
- Monitor deployed applications, their status, and runtime behavior.
- Track sub-deployments, servlets, and application health.
- Track active, created, expired, and rejected sessions.
- Monitor session lifecycle and average session duration.
- Analyze EJB lifecycle metrics such as pooled, active, and passivated beans.
- Track servlet invocation count and execution time to identify slow components.
- Monitor entity manager sessions, database connections, and query execution.
- Analyze transaction success rates and query cache performance.
- Receive real-time alerts on performance degradation and failures.
- Reduce MTTR with actionable insights across all components.
Get started
- Navigate to Plugins > Enterprise Applications > JBoss
- Set up your monitor using the On-Premise Poller and start exploring detailed performance metrics for your JBoss environment.

This feature is supported from On-Premise Poller 6.8.4 onwards.
For more details, please refer to our help documentation.
Do you have any questions or feedback? Share them in the comments.
Happy monitoring,
The Site24x7 team
Topic Participants
Deva Priya