Troubleshooting Kubernetes deployment failures
When something goes wrong during application deployment, it becomes all the more crucial to diagnose the issue methodically and get things back on track. This guide walks you through practical steps for troubleshooting deployment failures efficiently.
What is a Kubernetes deployment?
A Kubernetes deployment is a vital component for managing and automating the rollout process for containerized applications. It guarantees smooth updates and scalability in contemporary software environments. It ensures that the desired number of pod replicas are running and allows for controlled application updates without downtime. Deployments handle tasks like scaling, rolling updates, and rollbacks when needed.
A deployment consists of:
- Pods: These are the smallest deployable units in Kubernetes, running one or more containers.
- ReplicaSets: These ensure a specified number of identical pod replicas are running.
- A deployment strategy: This defines how new updates are rolled out, such as rolling updates or recreating all pods.
Thus, we learn that with the help of Kubernetes deployments, we can automate scaling, self-healing, and version control for our applications, making them more resilient and manageable.
What are Kubernetes deployment failures?
Despite Kubernetes' automation capabilities, deployments can fail due to various reasons, leading to performance degradation or downtime. Some common failure scenarios include:
- Pods stuck in the pending state: This occurs when the scheduler cannot locate a suitable node due to resource limitations or taints.
- CrashLoopBackOff errors: These depict a state when a container repeatedly crashes and restarts because of misconfigurations, missing dependencies, or application errors.
- ImagePullBackOff errors: Kubernetes cannot pull the specified container image, often due to incorrect image names, missing credentials, or connectivity issues.
Now, let us dive into the checklist you need to identify and fix your deployment failures.
1. Check the deployment's status
If your deployment isn't running as expected, start by checking its status:
kubectl get deployments
If you get an error message like the one below, it means the adservice deployment is unavailable:

You can also use the command below to get detailed insight into the deployment:
kubectl describe deployments <deployment name>

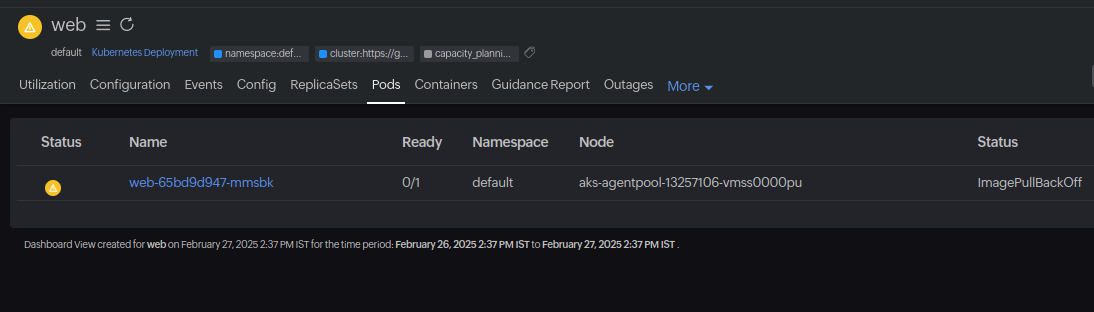
2. Check the pods' status
Next, inspect the pods to see if they are running or stuck in an error state:
kubectl get pods
- Pending pods: The scheduler can't find a suitable node.
- CrashLoopBackOff : The container repeatedly crashes and restarts.
- ImagePullBackOff : Kubernetes can't pull the container image.
For more details, describe the pod:
kubectl describe pod <pod-name>
For further troubleshooting, open a shell inside the pod:
kubectl exec -it <pod-name> -- /bin/sh
3. Review pod logs
Inspect your pod logs for errors:
kubectl logs <pod-name>
Inspecting the pod log statement will help you spot errors at the application level, which helps in more pointed troubleshooting.
If there are multiple containers running in the same pod, you can use the following to inspect a specific container:
kubectl logs <pod-name> -c <container-name>
4. Review event logs
Review the latest events to check if there are any issues with respect to your deployment:
kubectl get events --sort-by='.lastTimestamp'
By inspecting the event logs, we can identify if there are any failedcreate or pendingpod events and do what's necessary.
5. Verify the deployment configurations
Even a small misconfiguration can prevent a deployment from starting. Before applying changes, validate your YAML file:
kubectl apply --dry-run=client -f <file>.yaml
Check for issues like:
- Incorrect image names or tags.
- Missing or incorrect environment variables.
- Invalid ConfigMap or Secret references.
6. Address scheduling issues
A pod may not be scheduled due to resource limitations or node conditions. Check the node's availability:
kubectl describe node <node-name>
If scheduling fails, look for taints blocking the pod placement:
kubectl describe node <node-name> | grep -i taints
There can be other reasons for scheduling failures, including the node being unavailable, as shown in the image below:

7. Investigate resource constraints
Pods can fail due to insufficient CPU or memory capacity. Check the resource limits:
kubectl describe pod <pod-name> | grep -i "cpu\|memory"
A result like the one below indicates that insufficient CPU and memory capacity has caused the deployment failure:

Check if pods are being evicted due to resource pressure:
kubectl get pods --field-selector=status.phase=Failed
8. Ensure networking and service connectivity
Ensure that the services associated with the deployments are running:
kubectl get svc <service-name>
Check the details of the configured services:
kubectl describe service <service-name>
If your pod is running but inaccessible, check if the service has the correct endpoints:
kubectl get endpoints <service-name>
Test the DNS resolution inside the cluster:
kubectl run -it --rm --image=busybox dns-test -- nslookup <service-name>
Also, verify that the NetworkPolicies aren't unintentionally blocking traffic.
9. Keep an eye on cluster health always
To catch deployment issues early, keep an eye on the cluster health and performance with a top-notch Kubernetes monitoring tool like Site24x7.
Site24x7's Kubernetes monitoring provides:
- Real-time deployment failure alerts.
- Pod and node resource utilization tracking.
- Component-level thresholds and dashboards for spotting where issues have occurred.
- Log analysis for anomaly detection.
- Forecasting for tracking the resource usage and planning the capacity at various levels so that there are no disruptions during deployment due to resource constraints.
Having overall observability of your Kubernetes clusters will ensure a healthy Kubernetes environment that can perform unflinchingly during any autoscaling phase.
Handling Kubernetes deployment failures
When Kubernetes deployments fail, a step-by-step troubleshooting approach such as the one above helps you resolve the issues efficiently. Checking logs, configurations, resource availability, and networking can uncover most problems. Plus, with proactive monitoring via tools like Site24x7, you can prevent many issues before they impact your applications.
Topic Participants
Grace Nalini