Managing resource contention in Google App Engine: Best practices for optimal performance
Are your App Engine applications suffering from unanticipated lags?
You’ve fine-tuned your Google App Engine deployment, but users still report occasional lags, increased latency, or unexpected errors. Could resource contention be the hidden culprit? Resource contention is a catalyst for performance lags when multiple applications, instances, or services compete for CPU, memory, network bandwidth, or other shared resources.
Understanding and redressing resource contention is essential for maintaining a smooth and scalable Google App Engine environment. This blog explores real-world scenarios, best practices, and how Site24x7 helps detect and analyze contention at the application and infrastructure level, ensuring optimal App Engine performance.
How resource contention impacts your App Engine environment
Use case 1: When unexpected traffic surges lead to slower responses
A sudden surge in user traffic during a high-demand event causes strain on resources in a cloud-based application running on App Engine. The platform automatically scales instances to handle the increased load, but since compute resources are shared, some instances experience CPU throttling. This leads to slower response times, delayed processing of critical operations, and potential errors that impact user experience.
A sudden surge in user traffic during a high-demand event causes strain on resources in a cloud-based application running on App Engine. The platform automatically scales instances to handle the increased load, but since compute resources are shared, some instances experience CPU throttling. This leads to slower response times, delayed processing of critical operations, and potential errors that impact user experience.
How to resolve it:
- Use manual scaling or pre-warm instances to prepare for traffic spikes.
- Upgrade to higher-tier instances (B2, B4) with more CPU and memory to handle the load more effectively.
- Leverage Site24x7 to monitor the golden signals of observability—such as latency, CPU, and memory—to detect bottlenecks early and take action before they impact users.
Use case 2: When background jobs disrupt live transaction processing
A cloud-based application running on App Engine schedules periodic background tasks, such as data processing or analytical computations, on the same instances handling live user transactions. These background jobs consume significant resources, causing delays in processing real-time operations. As a result, users experience lag, slow responses, and potential disruptions during critical interactions, leading to dissatisfaction and missed opportunities.
A cloud-based application running on App Engine schedules periodic background tasks, such as data processing or analytical computations, on the same instances handling live user transactions. These background jobs consume significant resources, causing delays in processing real-time operations. As a result, users experience lag, slow responses, and potential disruptions during critical interactions, leading to dissatisfaction and missed opportunities.
How to resolve it:
- Offload resource-intensive background jobs to a separate App Engine service or ensure Cloud Run auto-scales independently, preventing compute spikes from impacting user-facing services.
- Set CPU and memory limits on background tasks to ensure they do not affect user-facing operations.
- Use Site24x7’s process monitoring to track resource consumption and optimize job scheduling, ensuring that critical live operations are not impacted.
Use Case 3: When database contention causes slow query responses
As a cloud-based application scales, multiple App Engine instances begin querying Cloud SQL simultaneously for real-time data. Over time, slow transactions emerge due to factors like lock contention, connection pooling limits, and inefficient indexing as concurrent queries increase. This results in delayed API responses, higher latency, and frustrated users who experience sluggish interactions when accessing critical data.
How to resolve it:
- Implement read replicas to distribute the query load and ensure faster read operations.
- Optimize SQL queries by indexing frequently queried fields and implementing connection pooling to reduce database connection overhead.
- Monitor Cloud SQL performance through Site24x7’s database monitoring tools to identify slow queries and optimize resource utilization, preventing bottlenecks during high transaction volumes.
How Site24x7 helps in managing resource contention
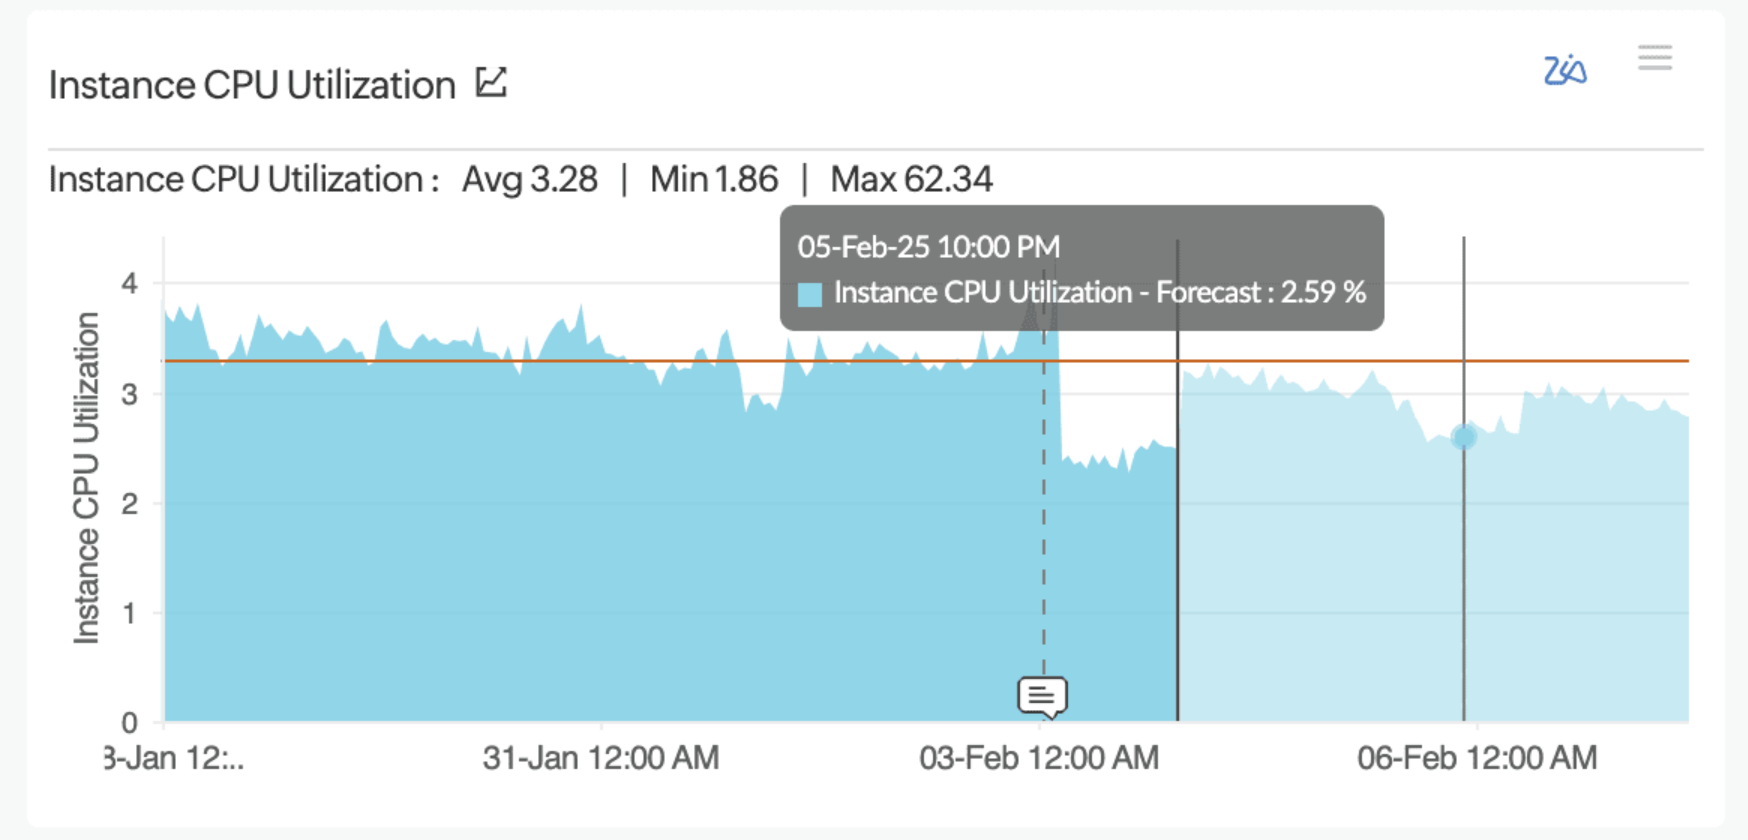
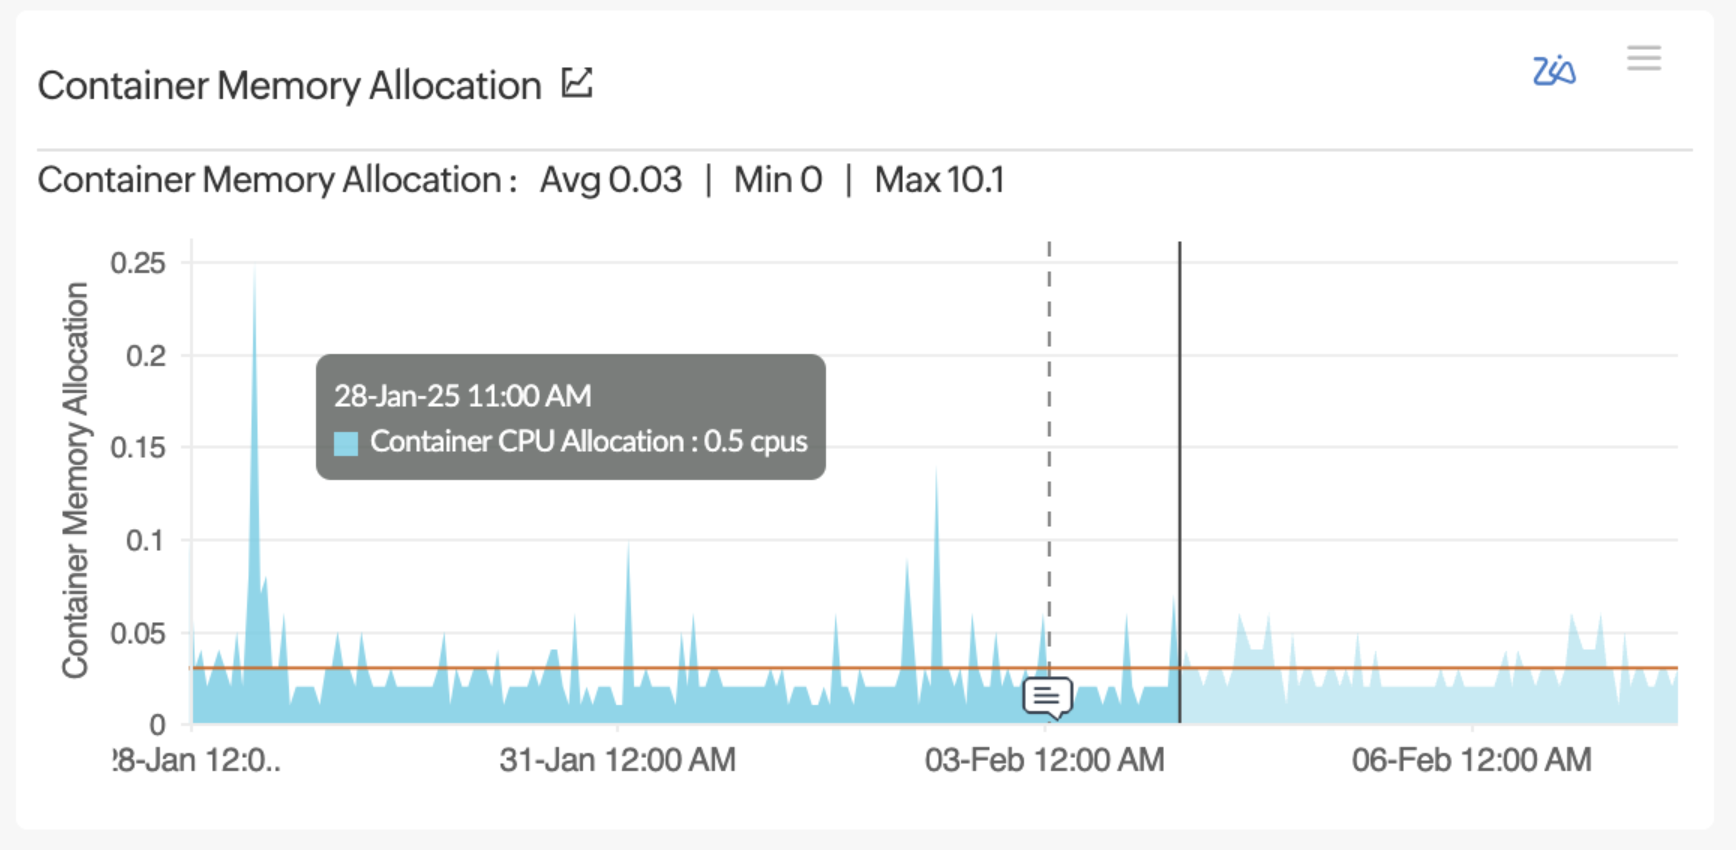
1) Real-time instance performance monitoring
Site24x7 provides deep visibility into App Engine instance performance, tracking CPU usage, memory consumption, disk I/O operations, and network bandwidth. Custom dashboards allow you to analyze trends and detect contention issues before they impact end users.
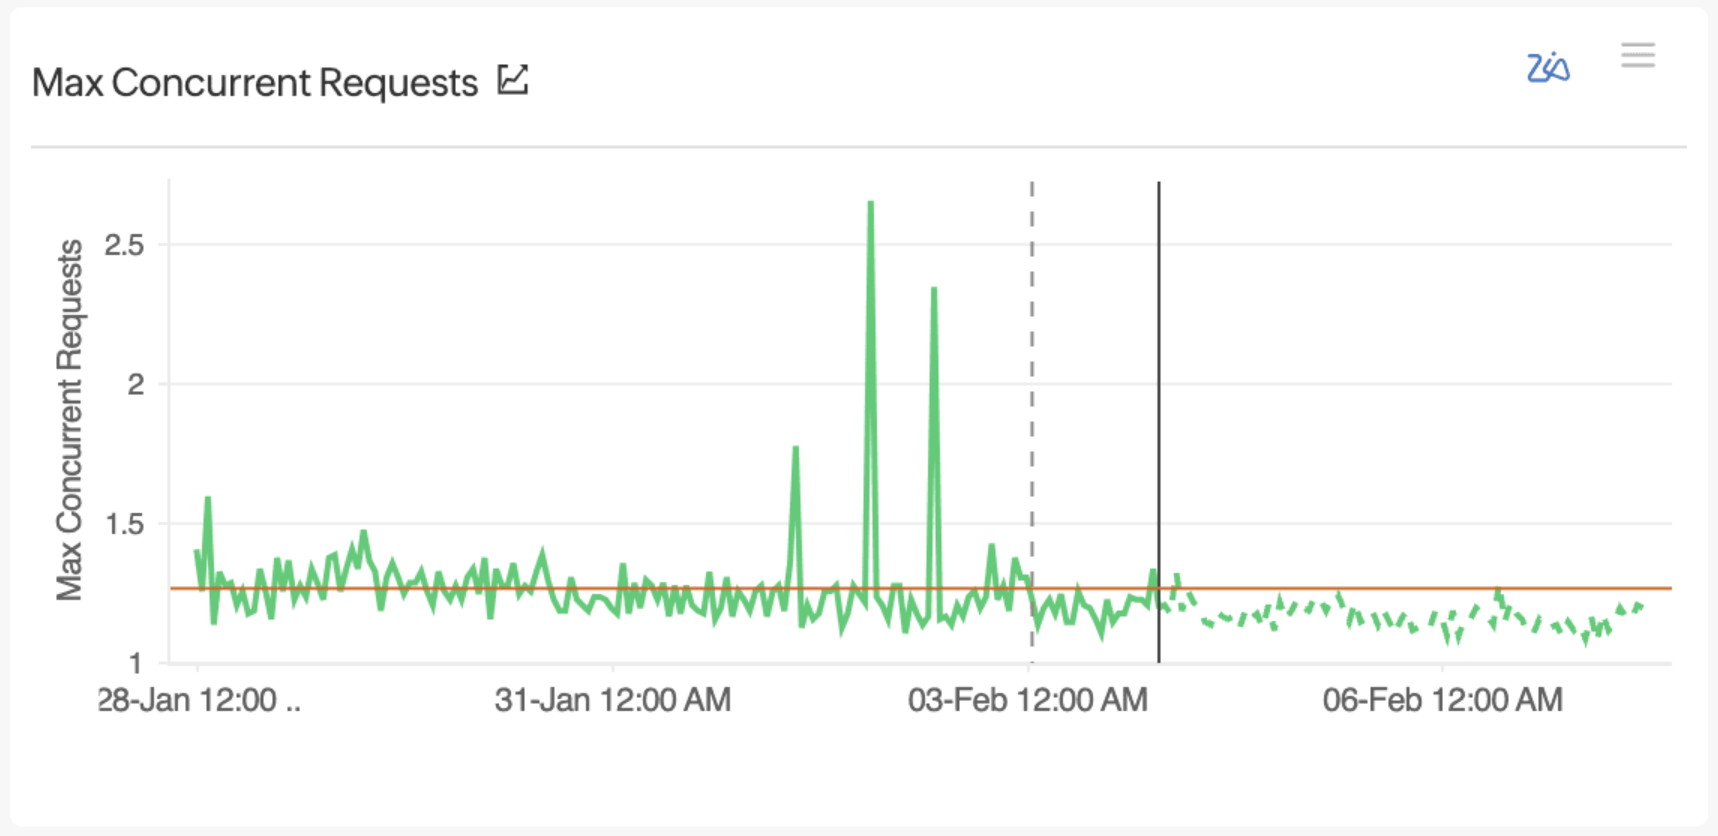
2) Automated alerts for contention scenarios
Set up threshold-based alerts for resource utilization to receive instant notifications when contention starts affecting performance. Site24x7’s AI-powered anomaly detection helps identify unusual spikes in resource usage.
3) Transaction monitoring for better user experience
Monitor App Engine request latency and transaction breakdowns to pinpoint slow API calls and optimize application responsiveness.
4) Database performance insights
Integrate with Site24x7’s database monitoring for Cloud SQL and Firestore provides query execution time metrics, slow query logs, and connection stats to help mitigate database-related contention.
5) Cost optimization with Guidance Report for GCP
Generate AI-driven best practice recommendations on cloud cost management via Site24x7's Guidance Report for GCP to identify underutilized instances and reduce wasteful expenditures. Set up budget alerts and anomaly detection in Site24x7 to prevent unexpected cost spikes.
Optimize, allocate, and prevent performance bottlenecks
Resource contention in Google App Engine can degrade performance, frustrate users, and impact business outcomes. By understanding contention scenarios and implementing best practices, you can optimize your App Engine workloads for better scalability and reliability.
Site24x7’s monitoring solutions offer intelligent insights and monitoring support for your entire Google Cloud, ensuring that your ecosystem performs optimally—even during high-traffic events. Start monitoring your GCP environment today.
Topic Participants
Mahalashmi Narayanan