Identify the root cause of issues in your application using APM trace details
Greetings!
We are glad to announce that Site24x7 APM Insight has enhanced the Traces tab to spot the root cause and resolve the issue by identifying the exact span of the trace.
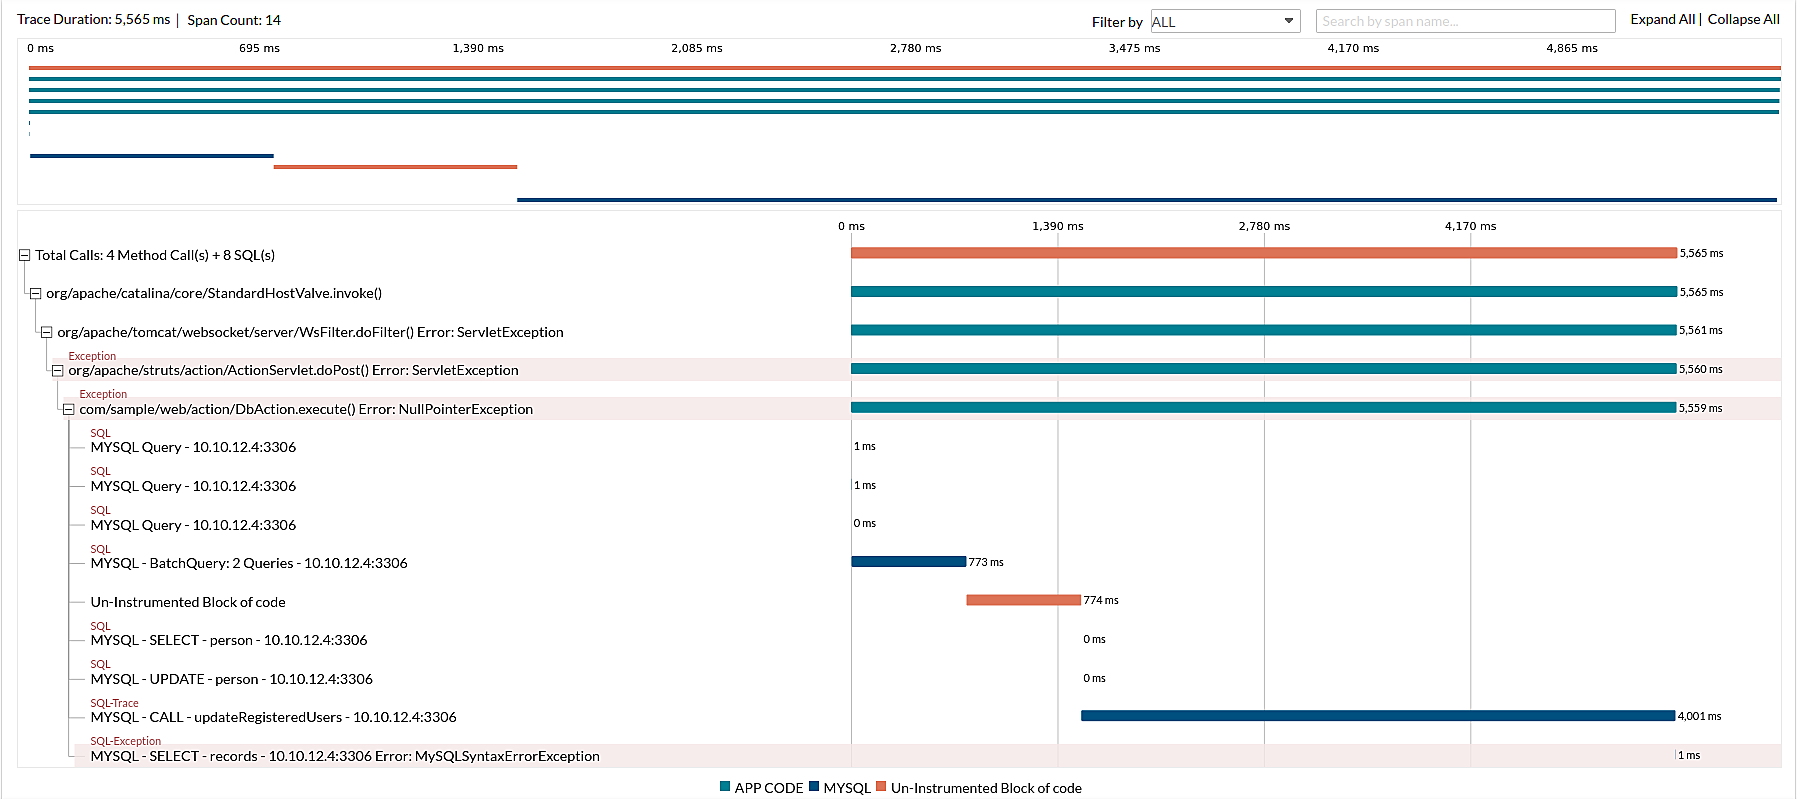
The Trace Details tab in APM allows you to investigate all entities involved in the trace in greater depth to find the anomalous spans that are potential sources of latency.
View trace details in UI
To view APM trace details:
- Log in to your Site24x7 account.
- Navigate to APM and click on your application.
- Go to the Traces tab and select the required trace.
- Finally, click on the Trace Details tab.

How does it help in real time?
The trace details feature in APM helps you monitor and analyze the behavior of your distributed system.
For example, assume you are troubleshooting errors in a complex transaction involving several services. Here is how you can do it with the help of APM trace details:
- Open the Traces tab.
- Sort your traces using a filter to find that specific request and show only traces containing errors.
- Click on the required trace.
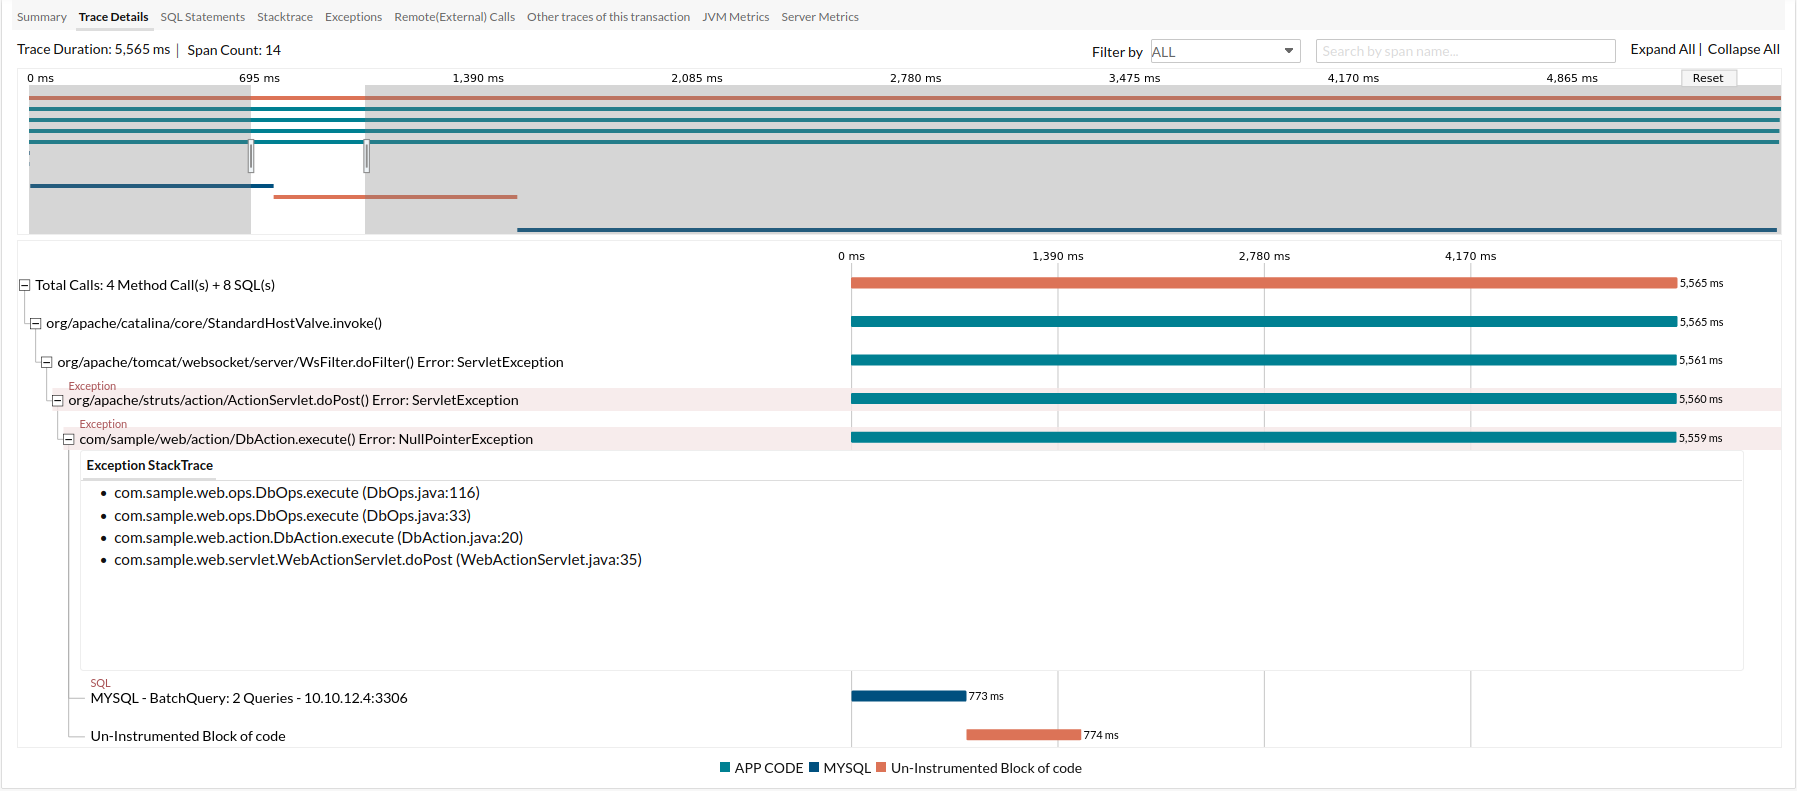
- On the Trace Details page, you can inspect the span along the request route that originated the error.
Note: You can also click and drag your mouse over the mini map to select the spans of that time duration. - Take note of the error class and error message, and then fix it.

Check out our help documentation for more information. Please reach out to support@site24x7.com if you have any questions.
Happy Monitoring!
Regards,
The Site24x7 team
Topic Participants
Deva Priya