Implement intelligent AIOps with Anomaly Dashboard
Using sensible thresholds for alerting and investigation is a tricky facet of modern infrastructure monitoring. Since static thresholds can never adapt to a system’s dynamic behavior, they can’t learn what’s normal and what’s not, and they end up generating too many false alarms and missed alarms.
At Site24x7, we're pioneering a new era of self-learning monitoring solutions based on artificial intelligence and machine learning algorithms. With the launch of our AI-powered anomaly and outlier detection mechanisms, you can basically do away with static thresholds and distinguish between normal and abnormal trends in your metrics, forecast potential outages, and fix issues before they start affecting customers.
Using anomaly data to boost DevOps productivity
Anomaly detection involves applying a set of robust techniques and predictive machine learning models to find unusual behaviors and/or states in systems. Site24x7 uses an AI-based anomaly framework to detect unusual spikes or aberrations in your monitored critical metrics, such as response time, CPU usage, and memory usage. DevOps technicians can use the anomaly data for better operational efficiency.
Here are a few ways operations teams can leverage anomaly data for faster incident resolution based on seasonality and trends:
-
Detect abnormal metric values to find otherwise undetected issues in your stack. An example is detecting high memory usage in a server, which may lead to a potential busy or idle server in the near future.
-
Identify drastic changes in an important metric or process so you can examine the situation to find potential issues.
-
Reduce the need to set or recalibrate thresholds across a variety of different monitors.
-
Reduce the troubleshooting time required to diagnose a problem in your stack.
Anomaly detection involves three steps:
1. Mathematical modelling: The anomaly engine uses a univariate algorithm for location-based monitors. It uses the Robust Principle Component Analysis (RPCA) algorithm for more efficient, reliable anomaly reporting. The anomaly engine spots anomalous behavior in data recorded for a single metric of interest, usually the response time attribute for all Internet Services Monitors. For agent-based monitors like Server and Application Monitors, where multiple attributes are tracked, the anomaly engine uses a Matrix sketching algorithm.
2. Anomaly event generation: This step involves all the heavyweight data crunching. For the univariate algorithm, the anomaly engine uses the last four weeks' worth of metric data for training the AI algorithm. The anomaly engine collects metrics from data collection agents every 15 minutes, and compares your KPIs against the trained data.
For the multivariate algorithm, the anomaly engine uses the 95th percentile values from the last four weeks' worth of data on correlated attributes to train the algorithm. We use the 95th percentile value because it snips off the top five percent of the highest values, removing any redundant spikes from the training data. Learn more.
3. Domain scoring: Scoring is a method used to measure anomaly severity. The anomaly engine assigns unique scores to events. Based on factors like domain scores, dependencies, and increased gravity of detected anomalies, anomalies are labeled as Confirmed, Likely, or Info. Read more about domain scoring.
Anomaly reporting with graphs and flexible alerting
By accessing the time series graph in the Anomaly Dashboard, you can closely inspect the behavior of the metric in question against other metrics at a given point in time. Read this article to learn how to interpret the anomaly data. You can also share the Anomaly Dashboard as a CSV or PDF.
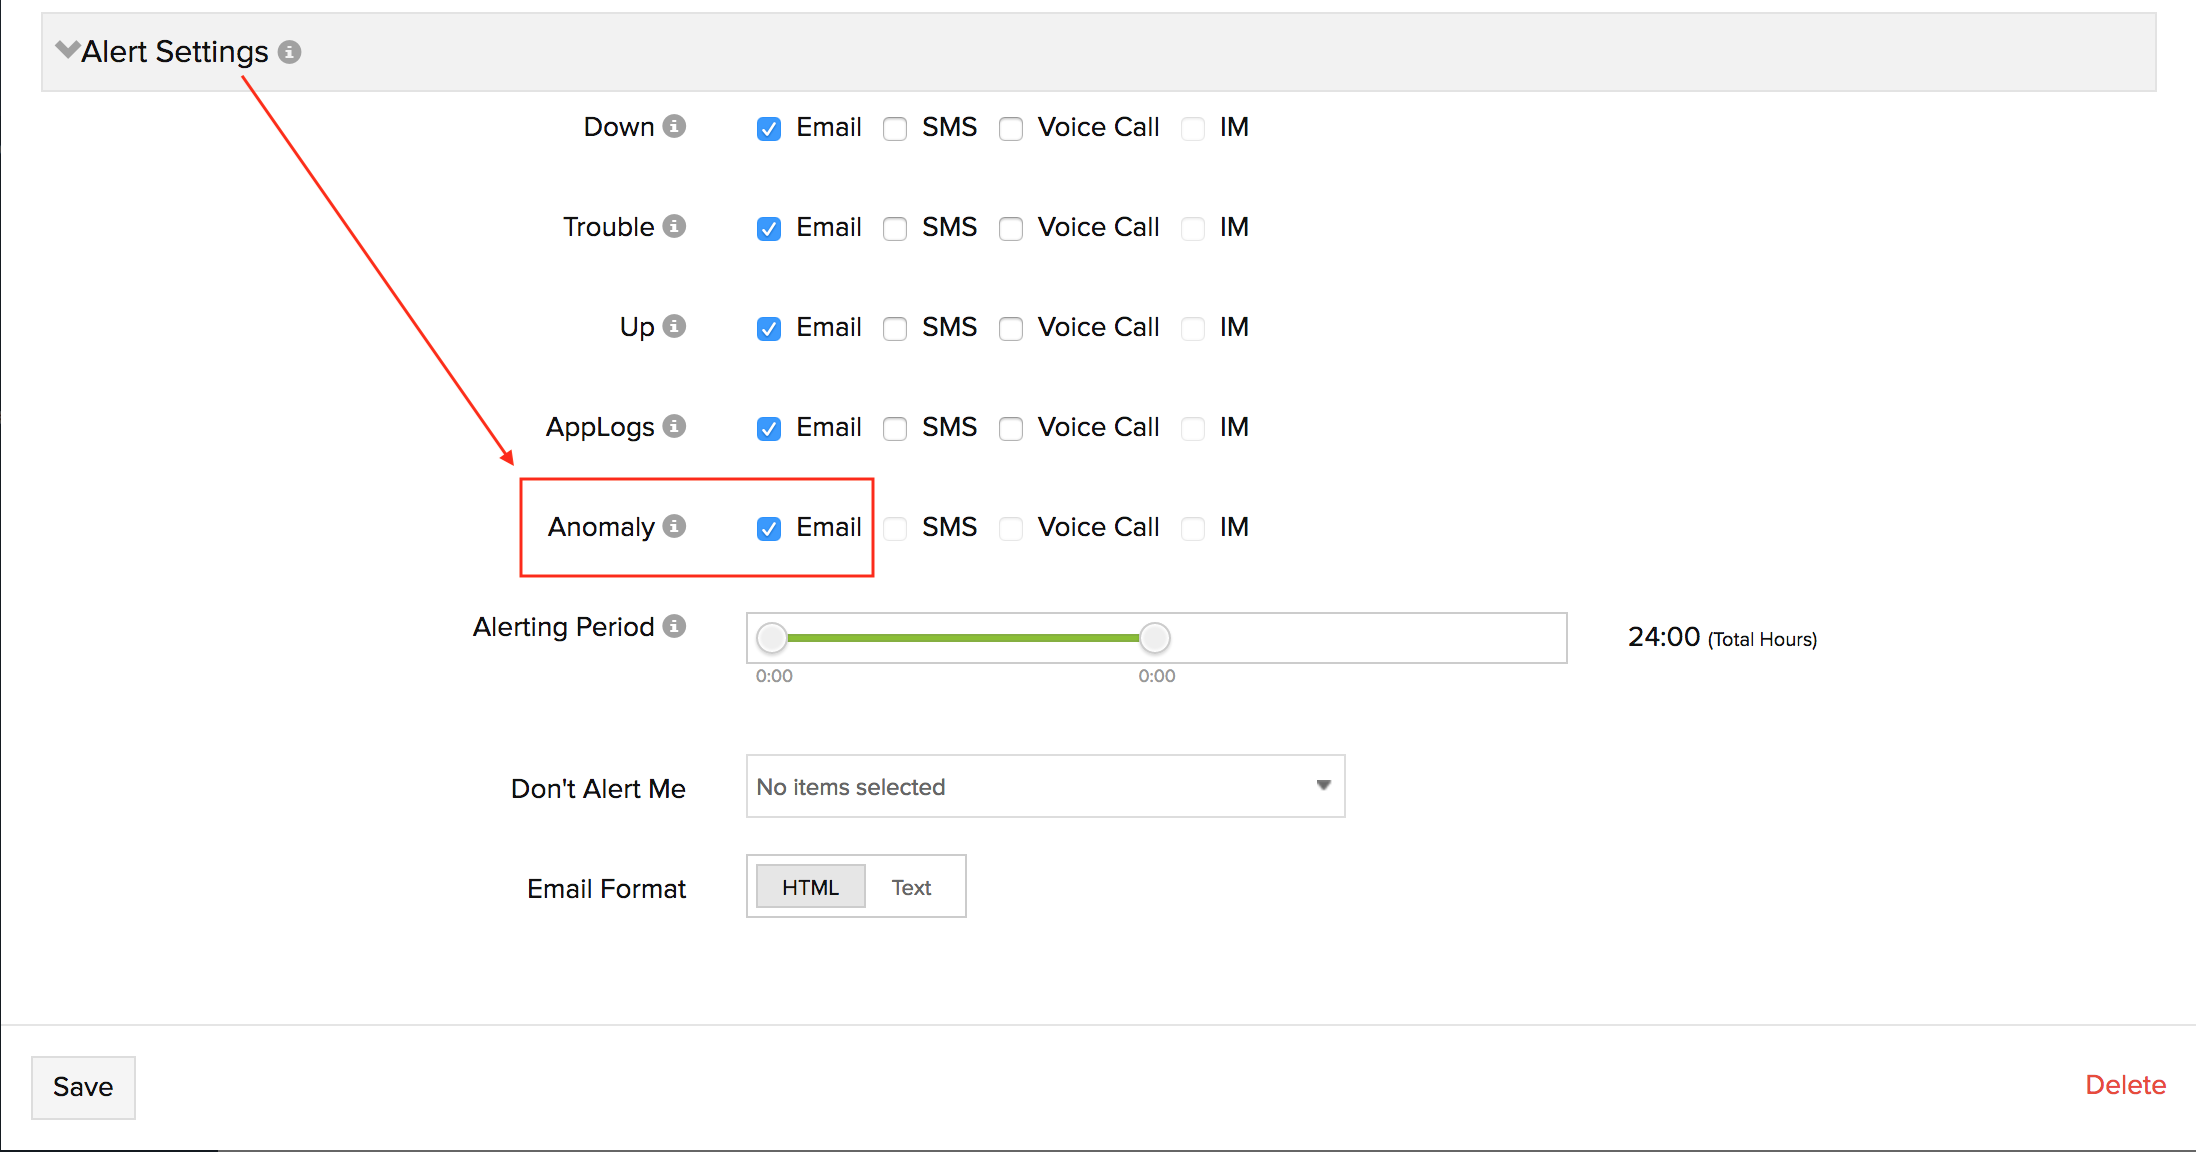
Alerting is an integral part of anomaly detection. When multiple anomalies occur, we send out an email notification once an hour to avoid a flood of alerts. To set up anomaly email alerts in Site24x7, log in to the web client and access Admin > Users & Alerts > Add Users > Advanced Settings; select Email as your preferred mode for alerting.
Get started now!
If you already have a paid Site24x7 monitor setup, you can head straight to detecting anomalous metrics from the Anomaly Dashboard. Anomaly detection is just the beginning; expect to see more features lining up for AIOps soon.
Feel free to leave your feedback in the comments section below. If you have any questions, please get in touch with us at support@site24x7.com.
Happy monitoring!
Topic Participants
Sven
Francisco Ramirez
Murali Krishnan
Saranya